
Hey trader,
Two big prints hit the tape this week. Only one has gamma behind it.
That distinction is what separates the trades worth chasing from the ones that look large but never move the underlying.
Most traders never make the cut. They see size, assume institutional positioning, and end up buying calls on flow that was never going to drive the stock.
The Block Hunter Console flagged a 45,000 contract TLT call print this morning and a 10,000 contract Nokia call print on Monday.
Different sectors, different sizes, and the trade readings point in opposite directions.
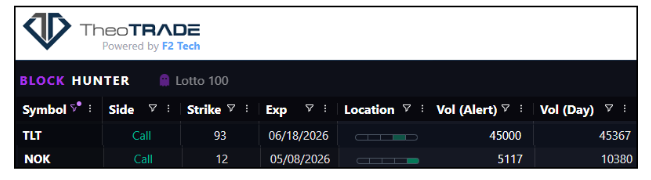
The TLT print is a roll. The institution already owned the position and just extended the timeline.
The Nokia print is fresh. The dealer who took the other side now carries short calls and has to chase price as the stock moves toward the strikes.
Nokia is already up 8% off Monday’s print. TLT has not moved at all.
The numbers in the headline tell you nothing about which is which. Time and sales tells you everything, and there is a debit spread that positions for the next leg of the Nokia squeeze.
How To Spot A Roll From Time And Sales
The TLT print looks bullish on the surface. Forty-five thousand June 90 calls bought is well above any single-day average for the bond ETF.
Time and sales shows the actual structure.
The same trader sold 45,000 May 89 calls in the matching print and bought the June 90s for an 18 cent debit.
That is a roll. The institution owned the May 89 calls, expiration was approaching, and they pushed the position out to June at a higher strike.
A second matched leg shows the 89/92 May spread closing as a 90/93 June spread opened in its place.
The whole structure moved out and up. The institution paid 18 cents per contract to extend an existing position they were not ready to close.
Why A Roll Has No Gamma
A 45,000 contract trade in TLT looks large in isolation. In context, it is nothing.
Average daily option volume on TLT runs around 329,000 contracts. The roll is roughly 14% of a typical day, and the underlying bond market is one of the largest in the world.
The dealer on the other side already had the position hedged.
The May calls being sold and the June calls being bought largely offset each other on a delta basis. There is no new exposure to neutralize, no new shares to buy, and no new pressure on TLT.
A fresh 45,000 contract print would carry gamma. A roll carries close to none.
The difference is hedging that already exists versus hedging that has to be put on for the first time.
What Real Gamma Looks Like
The Nokia print on Monday tells the opposite story. Ten thousand calls were bought at the $12 strike with the stock trading near $11.
That is a fresh position. The dealer who sold those calls now holds 10,000 short calls with rising delta as Nokia approaches the strike.
Selling calls produces positive theta, which means the dealer is also negative gamma.
Negative gamma forces the dealer to buy stock as price rises and sell stock as price falls.
The result is asymmetric. The dealer’s hedging needs accelerate as Nokia moves toward $12, then accelerate again when the stock breaks through it.
Brandon calls this “two and through.” The strike acts as gravity.
Price gets pulled toward it by dealer hedging, then breaks through it on the same math, then gets pulled toward the next stacked strike.
Nokia has stacked strikes at $11.50, $12, $13, and $16. The stock cleared $11.50 on Tuesday and broke $12 this morning.
The Setup On Nokia
Nokia ran 8% today on Monday’s print. The chart did not confirm the move until two sessions later.
A trader watching the chart for confirmation entered at $12 instead of $11. A trader reading the Console on Monday entered at the start.
The setup is not finished. With $13 and $16 still on the board as flagged strikes, the squeeze has room to extend.
- Buy the NOK 30 to 45 day $12 call
- Sell the NOK same expiration $14 call
- Spread width: $2
- Max risk: Limited to the debit paid
- Direction: Bullish on continued gamma squeeze
- Catalyst: 10,000 contract fresh call position at $12 strike, dealer negative gamma, stacked strikes at $13 and $16
If Nokia clears $14, close the spread and roll up to the $14/$16 strikes. The same gamma mechanics work at every level above as long as the dealer remains short calls into the advance.
The Three Questions For Every Print
Every print on the Console deserves the same three questions before you act on it.
Does time and sales show a matched leg or a one-sided fill. A matched leg means a roll. A one-sided fill means a new position with new dealer exposure.
Does the print size matter relative to the underlying market.
Forty-five thousand contracts in TLT is small against the bond market. Ten thousand contracts at a $12 Nokia strike is meaningful against a stock that trades closer to $11.
Does the dealer carry new exposure to hedge.
A roll transfers existing exposure between strikes. A fresh print creates new exposure that has to be neutralized through stock activity in the underlying.
The TLT roll fails all three filters. The Nokia print passes all three.
The math behind why one trade has driven Nokia 8% higher and the other has not budged bonds comes down to those three questions.
See exactly how Block Hunter catches institutional positioning before the crowd catches on.
Brandon Chapman, CMT
Creator of Ghost Prints