Hey trader,
I call it the forward read. The VIX futures curve shows me how much volatility the market expects in the months ahead, and that tells me whether to buy options or sell them.
Plenty of traders watch the VIX itself, and its key levels can help. Others learn the contango and backwardation labels, and that’s a fine place to start.
Yet neither one hands you a plan. I keep it simple and compare the price of one month’s contract to the next.
That slope is only half of it. The other half is knowing which trades fit the volatility it’s pricing in.
A member asked me about the VIX futures curve in the room Tuesday. December sat at 21.5, January at 21.6 and February at 21.8.
That curve told me the low volatility we’d had since August is gone. It also told me I’m going to be an option seller.
What does that mean for your next trade? I’ll walk you through how I read the curve, then the trades I lean on when it rises.
How I Read The VIX Futures Curve
The VIX measures how much movement options traders expect from the S&P 500. Each VIX futures contract prices that expectation for a future month.
Line those contracts up month by month, and you get the VIX futures curve. I read its slope.
You’ll hear two labels for that slope. Contango means later months price higher, and backwardation means they slide lower.
I told the room you don’t have to worry about those labels. I simply check whether the market is pricing in a higher number down the road.
The market always prices in its expectations of the future. A rising VIX futures curve says the market expects volatility to stay up or climb.
I prefer the futures over the VIX itself for this read. The VIX jumps from level to level, so I only use its key levels.
The futures let me trade a trend.
What Tuesday’s VIX Futures Curve Told Me
A member asked whether the VIX futures curve showed contango into December or January. I pulled up the contracts right there in the room Tuesday.
December sat at 21.5, January at 21.6 and February at 21.8. Each month priced in a little more volatility than the one before it.
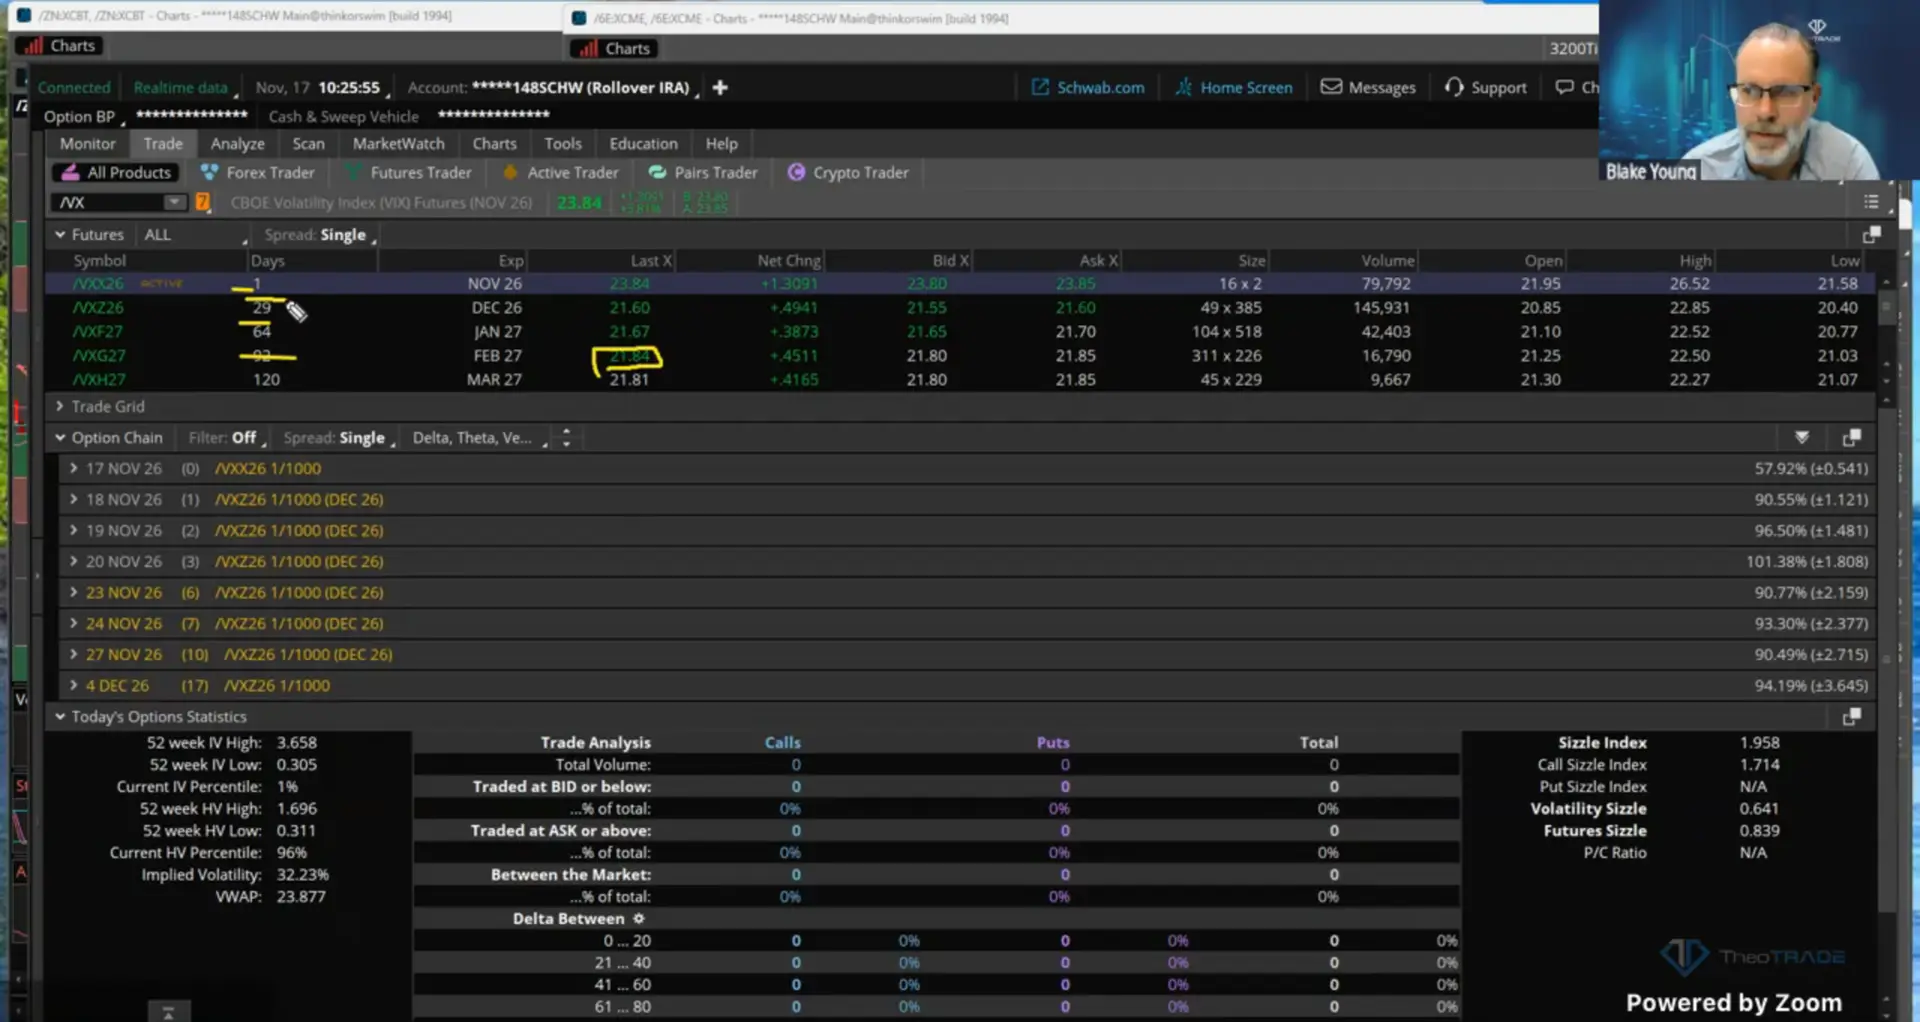
That slope told me the stretch of low volatility we’d had since August is gone. I expect volatility to hold around this level.
I gave the room two takeaways from the curve:
- We probably have more downside expected.
- I’m going to be an option seller.
I also told the room the market doesn’t see this as a one-and-done. My view is we’re likely headed into a less bullish 2027.
Why A Rising VIX Futures Curve Makes Me An Option Seller
High volatility keeps options expensive, and option sellers collect that extra premium. Tuesday’s options showed how expensive they’d gotten.
XSP is the mini S&P 500 index option. Its expected move is the range its options price in for the rest of the day.
That move usually sits under $2 by two hours into a normal session. Tuesday’s was $4.15, about double the usual.
I don’t need to pick a direction to collect that premium. I lean on delta-neutral trades instead.
Delta measures how much an option’s price moves with the underlying. A delta-neutral trade starts near zero, so a small move won’t help or hurt it.
The structures I named Tuesday were calendars, double calendars, iron condors and butterflies. Each one lets me sell volatility without betting on direction.
A double calendar shows how that works. I buy a longer-dated out-of-the-money call and put, then sell shorter-term options against them.
I priced one Tuesday on NVIDIA, where earnings had pushed the one-day options to almost three times the volatility of later months. The short side collects that inflated premium while the long side stays in place.
I walked through that trade as analysis only. I never reported placing it, so I won’t claim a result.
A rising VIX futures curve tells me to sell premium.
Run The Forward Read On Your Own Chart
You can run this check in a few minutes before you plan your next options trade:
- Line up the next few months. Ignore the contract that expires in a day and compare the months after it.
- Check the slope of the VIX futures curve. If later months price higher, the market expects volatility to stay elevated or climb.
- Lean toward selling premium. Favor delta-neutral trades like calendars, iron condors and butterflies.
- Check each stock before you sell. Below 35% implied volatility I’d rather buy, above 50% I sell, and in between I run the numbers.
That’s my line, and it doesn’t have to be yours.
A less bullish market doesn’t scare me. I told the room pullbacks are opportunities, and you can sell premium right into them.
Read the curve first, then pick the trade that fits the volatility.
I also told the room the next year could be phenomenal for option sellers. That only happens if you know when the market is overpaying you.
Tuesday’s read started with one member question, and I answered it live with the contracts on screen. If you want to watch reads like this happen in real time, start with the free 10AM Bell webinar.
Read the slope of the VIX futures curve, then sell the volatility it’s pricing in.
Blake Young
Senior Market Strategist, TheoTRADE