Hey trader,
Earnings headlines don’t always tell you how a stock will react. Even a comprehensive analysis of the report can still come up short.
The options market, on the other hand, can provide a clearer signal than most traders realize. And once you learn how to read it, you’ll have a leg up on the competition.
I saw this exact phenomenon play out this morning.
Wells Fargo beat earnings and still fell right to $81.
That might seem counterintuitive and random…but it wasn’t.
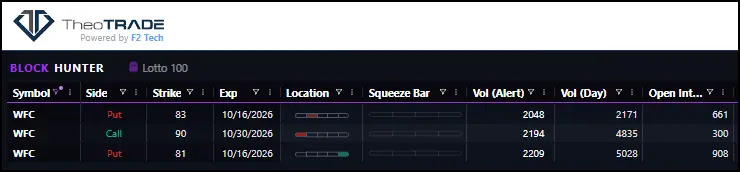
Yesterday, I flagged about 5,000 Wells Fargo puts bought at the 81 strike for this week’s expiration.
Still think it’s a coincidence?
But before you start looking for big option trades leading into earnings, let me take you through my process to evaluate the two together. That way, you understand not only what to look for but how to read it.
How I Screened the Bank Earnings
Yesterday, I went through every financial stock reporting this morning on the Block Hunter Surveillance Console. I wanted to know which ones had real option trade behind them.
Wells Fargo was the only one with a decent amount of trade.
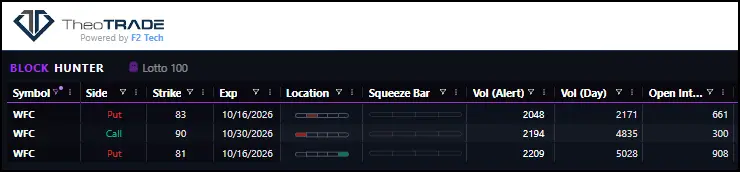
Three alerts came out of Wells Fargo, at the 81, 83 and 90 strikes. Two of them filled at the bid.
The 81 puts filled at the ask. That’s the alert I zeroed in on.
Filling at the ask basically means the buyer paid the seller’s price to get in. Buyers who pay up usually want the position badly.
What Made the 81 Puts Worth Following
I filtered for trades of 100 contracts or more. The 81 puts showed up as a sweep, which is one order split across several exchanges and filled all at once.
Hundreds of contracts filled at the same moment, priced between $0.99 and $1. Nearly all of them went off at the ask.
By the end of the day, the strike had traded past 5,000 contracts. That’s not a small amount for Wells Fargo.
The print checked all three boxes I look for in unusual option activity:
- Out of the money: The 81 strike sat below where Wells Fargo was trading, around $83.
- Short-dated: The puts expire this week.
- Bought: The sweep filled at the ask.
A print like that hands me a symbol, a direction and a target. The expiration gives me the time frame.
Why Wells Fargo Fell to the Strike
The dealer sold those puts. To hedge short puts, a dealer shorts shares right away.
As price falls, the dealer has to short even more. I call that move “to and through,” since the pressure builds as price reaches the strike and pushes past it.
Traders call the force behind that extra selling gamma. It’s basically how much an option’s delta, or its sensitivity to the stock, changes on a $1 move.
The report came out early this morning. Wells Fargo first popped as high as $84.57.
Once the decline started to stick, dealers kept shorting into it. Wells Fargo got down to $81, the same strike those puts were bought at yesterday.
I don’t read that as a coincidence. Dealers have to hedge, and their hedging moves price.
How the Walls Framed the Rest of the Day
Wells Fargo also had a put wall at $80. A wall is simply a strike with a huge pile of option contracts sitting on it.
Price bottomed right at $80. It bounced and stalled at $82.50, a put wall Wells Fargo lost overnight that now acts as resistance.
Today’s trade didn’t change any of that. Only about 2,800 contracts traded at the 81 strike today, far too few to shift the levels.
If $80 breaks, the next level sits at $75. I don’t think Wells Fargo gets there.
A put vertical aimed at the downside would’ve paid big time this week. That basically means buying one put and selling a lower one against it to cut your cost.
Before your next earnings trade, scan the names reporting for real option activity first. Check whether the biggest print is out of the money, short-dated and bought.
Then map the walls above and below it. Those levels can tell you where the stock is likely to stall before the headline even crosses.
Reading a print before earnings is part of every session I run with members. The 90-Day Block Hunter Challenge is where I hand you the same tools I used on Wells Fargo.
Here’s what you get when you join:
- The Block Hunter Console, scanning hundreds of names for hidden pressure.
- 2 to 3 block alerts a week, plus one high-upside setup every Friday.
- The live Masterclass and 12 weeks of mastermind sessions with me.
- Ghost Hour from 11:30 to 12:30 EST every weekday. That’s the window when the market moves fastest and the prints tend to show themselves.
Recent Block Hunter reads include SILJ +392%, PLUG +222%, NKE +142% and GDX +72.5%.
Earnings season is just getting started. The next print pointing at a target might already be sitting on the Console.
Your next 90 days start today, and your seat is protected by a full 30-day money-back window.
▶ Join the 90-Day Block Hunter Challenge
Brandon Chapman, CMT
Creator of Ghost Prints