AAPL Beats Estimates But iPhone Sales Decline
AAPL reported Q1 2018 EPS of $3.89 which beat estimates for $3.86. Revenues were $88.3 billion which beat estimates for $87.28 billion. The chart below shows the changes to 2018 full year earnings estimates as a result of the quarter. The low estimate came up; the high estimate came down more than the low estimate went up. The consensus mean increased slightly getting it back to where it started the year. The consensus for net income is converging at about $58 billion. That is 8% earnings growth on top of the 2015 super cycle earnings; it’s up 32% from last year. It’s important to compare Apple to super cycle peaks because it is becoming inconsistently cyclical meaning some new iPhone iterations don’t sell well. It’s important to contextualize results instead of simply saying the sales were up a lot compared to a weak year.

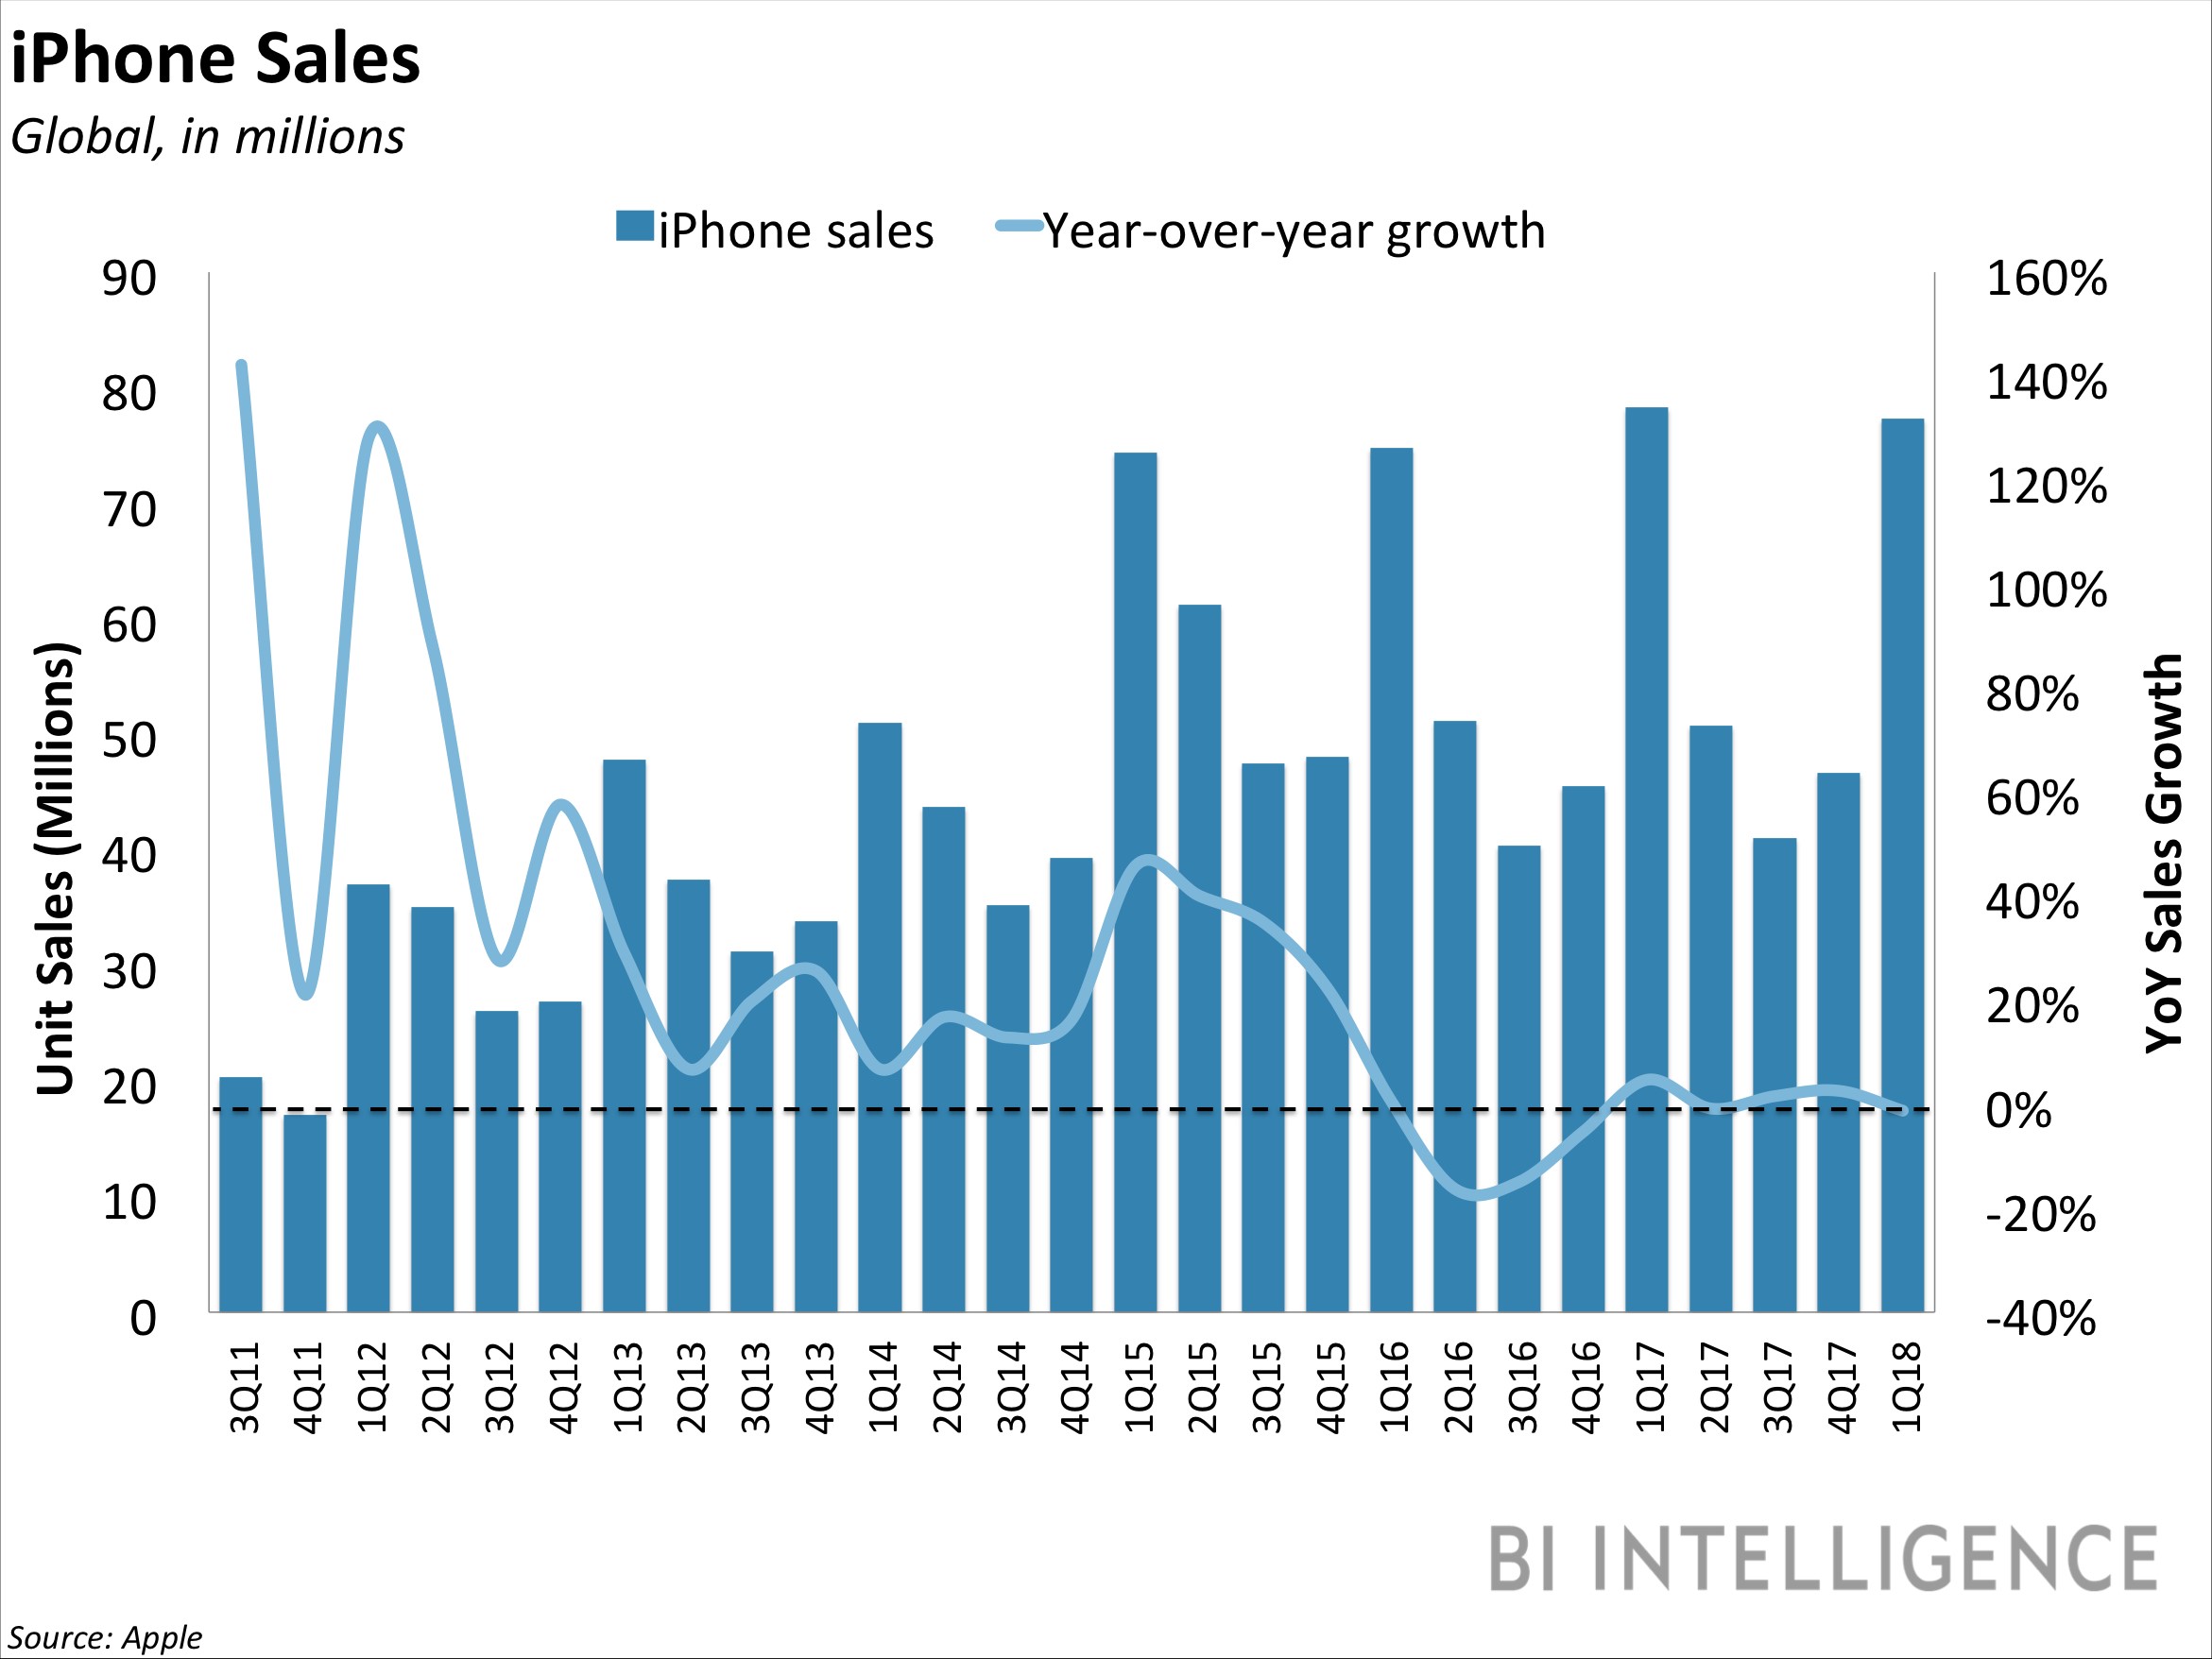
Even though AAPL reported great top and bottom line beats, investors saw hair on the quarter. Hair is weakness beyond the headline numbers. The biggest problem was iPhone unit sales which came in at 77.3 million. That was below the expectation for 80 million. As you can see in the chart below, Apple saw a decline in iPhone shipments as last year the company sold 78 million devices.
Apple’s weak iPhone sales growth isn’t because the company failed to meet the desires of the consumer. As you can see from the chart below, the weak sales growth is following the total smartphone market. This market has been saturated for about 2 years. Apple’s weak 2016 was a result of not meeting consumers’ needs. Recently it has been in line with the overall market. Keep in mind the chart below is based on the normal calendar, but Apple’s reporting schedule calls last quarter Q1 2018, so that is adjusted in this chart.

The table below reviews the smartphone operating system market share in a few key countries. As you can see, Apple gained share in Germany, Spain, China, Australia, and Japan. The biggest gain was in China which saw iOS jump from 18.5% to 28.6%. That’s still much lower share than America, but it’s a big improvement. The market share has been very volatile in China. The country’s consumers appear to have liked Apple’s latest devices.

Heading into the quarter some bulls were expecting a miss on the iPhone sales results which would be made up by the increased average selling price which would come from the more expensive iPhone X being added into the mix. This ended up being correct. As you can see in the chart below, the average selling price of the iPhone was $796.42. This beat expectations for $755.78. Keep in mind, the iPhone 8 costs $699, the iPhone 8 Plus costs $799, and the iPhone X costs $999. The historical chart shows how the iPhone’s price started to fall in the first few years after it was released, like most consumer products. Then Apple shifted the trend by releasing the Plus model. This latest price increase was the most important in the history of iPhone. It came at a great time because the industry is stagnating. It makes sense that the price of smartphones has increased because, unlike most consumer technology products, it has become dramatically different. It went from being a phone with a few cool features, to people’s main computer.

Apple’s services business had revenues of $8.5 billion which was up 18% year over year, but missed expectations for $8.67 billion. This business is now 27% of gross profit dollars. The company’s install base of iPhones has increased by 30% in the past 2 years to 1.3 billion. The company has correctly shifted its focus towards the monetization of old users now that the upgrade cycle has been elongated. The company hit 240 million paid subscriptions which was 58% growth from last year. The rumors that Apple will buy Netflix must be put to rest because the company already has an expansive services business. Why pay an excessive multiple to gain what it already has? The goal for an acquisition is to obtain a business which can’t be built in house.

The charts below show the breakdown in earnings by category and by region. The iPhone obviously dominates earnings. It’s disappointing to see Mac sales down 5%. It’s encouraging to see the other products division, which includes the Apple Watch, AirPods, Beats, and Apple TV, had revenue growth of 36%. The revenue growth from wearables alone was almost 70%. The company is releasing the HomePod device, which is a smart speaker, on February 9th. This makes sense because it needs to compete with Amazon’s Echo and Google’s Home. The problem lies in the fact that Apple’s Siri assistant isn’t nearly as good as Google Assistant. This could become problematic as the technology improves because people will use it more often. Currently, even though the tech is much better than a few years ago, it still is more efficient to do the task yourself, meaning using a search engine instead of verbally asking for information.

The biggest problem with the quarter besides the iPhone sales miss was the weak guidance. The firm expects $60 billion to $62 billion in revenues for Q2 which missed estimates for $65.73 billion. Q2 margins are expected to be 38% to 38.5% which missed estimates for 38.9%. The stock sold off on Friday because of the poor guidance and weak iPhone sales. The sell off is especially disconcerting because the stock had already been down heading into the report. With the 4.34% decline on Friday, the stock is down 10.47% from January 18th. The stock had popped at the end of the after hours session on Thursday evening, but that must have been a few low volume trades. It’s tough to say if Apple’s weakness on Friday is what drove the market down or if the weakness drove Apple stock down. Either way, it’s performance wasn’t out of the norm as Friday was by far the worst trading day of 2018.
Recent Comments