Capitulation Moment?
Capitulation - Whenever the market corrects or falls into a bear market, investors are always trying to spot the bottom to make a quick profit. The American stock market has had the best real returns out of any country’s stock market in the past 100 years.
It’s not a given that stocks will always have great real returns. But it’s not outlandish to expect short term and medium term rallies after big declines. Especially such as the rally in Q1 2019 after the decline in Q4 2018. The stock market could fall a bit more after the decline on Monday.
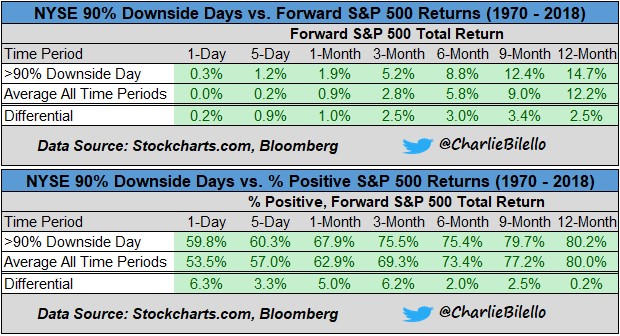
One point which counters that notion is the fact that 90% of the NYSE volume on Monday was to the downside. That’s the first time that happened since last December. In the past year, it occurred once in October and once in December. Both were oversold moments.
As you can see from the table below, after 90% downside days, the S&P 500 increases 12.4% in the next 9 months on average. That is a 3.4% outperformance over all 9 month periods since 1970. This points to the Monday selloff being a washout moment where investors capitulated and sold everything. Stocks rallying on Tuesday provides a small bit of verification to this thesis.
Redbook Growth Falls
Capitulation - In the week of May 11th, Redbook same store sales growth fell from 5.9% to 5.4%. This is still a decent result. Bulls hope it correlates with strong real Q2 consumption growth.
April retail sales report will be released on Wednesday. Expectations are for 0.2% headline monthly growth and 0.4% monthly growth in the control group.
NFIB Small Business Confidence Improves
Capitulation - NFIB small business confidence index followed the stock market’s performance in April by increasing from 101.8 to 103.5. That beat estimates for 102.4 and beat the high end of the consensus range by 0.1.
As you can see from the chart below, it’s still down from its peak late last year. It’s only slightly below the peaks it reached from 1986 to 2003. None of the indexes in this report fell and all but one rose.

The biggest improvement was in the net percentage of small businesses saying earnings trends improved. That went from -8% to -3%. Usually, that index is negative, so don’t view it as a terrible reading. Net plans to increase inventories and net expectations for credit conditions to improve were both up 3%. Those readings were 2% and -4%.
As you know, the Q1 build up in inventories boosted GDP growth. Regardless of what this index said, inventory growth probably won’t be strong in back to back quarters. I wouldn’t be surprised if small businesses became more negative on credit conditions if they were asked the same question today. Primarily because of the selloff in high yield bonds and stocks caused by trade worries.
In my opinion, the 2 most important categories in this index are net expectations for real sales to increase and net plans to make capital outlays. Those get at how business is doing rather than measuring economic sentiment which can be flippant. Those indexes didn’t improve much as one was up 1 point to 20% and the other stayed the same at 27%.
Net plans to increase employment were up 2% to 18%.
As you can see from the table below, 24% of small businesses stated quality of labor was their biggest issue. 3% more named it their biggest issue in April than March. It’s interesting to see how cost of labor was only named by 8% as their biggest issue.
These two aspects go hand in hand. If a firm really wants to find workers, it can offer more pay and give more benefits. That would make quality less of an issue and cost more of an issue.

International Firms Underperform
Capitulation - Investors have always been interested in FactSet’s final Q1 earnings growth calculation. Personally, I have expected it to be very close to the flat-line. Some calculations such as The Earnings Scout’s already have Q1 earnings growth much above the flat-line.
FactSet’s results should show if those predicting an earnings recession 3 months ago still have a leg to stand on. With 90% of S&P 500 firms reporting earnings, FactSet shows earnings fell 0.5%.
Therefore, even if most of the firms in the final 10%, which haven’t reported as of this calculation, beat estimates, there will likely be a very minimal yearly decline in EPS. I’m guessing the final result will be between -0.3% and 0%.
On the other hand, FactSet shows Q1 revenue growth was 5.3%. This isn’t as much of a downturn as investors expected 3 months ago even if EPS growth ends up being negative 2 quarters in a row.
To be clear, Q1 could have the first EPS decline since Q2 2016 when EPS fell 3.2%. That wasn’t close to the depths of the 2015-2016 earnings recession. With this year’s comps so high, slight earnings declines aren’t that bad as the 2 year growth stack is still strong.
FactSet’s Q2 estimates are just like The Earnings Scout’s in that they are worse than Q1’s estimates at this point in the previous quarter.
Capitulation - FactSet already has Q2 earnings falling 1.7%.
With a bit more of a decline in the next couple months, Q2 would need to beat estimates by much more than average to see positive growth.
Therefore, FactSet is likely to show 2 straight quarters of very slight earnings declines. The Earnings Scout won’t show 2 quarters of declines unless Q3 estimates fall. In terms of predicting where stocks are headed, Q2 estimates will matter for a few more weeks, and then the focus will shift to Q3 estimates. FactSet’s Q2 estimates fell less than average in April which supports this bull market.
As you can see from the chart below, Q1 was deeply hindered by international business as global economic growth has slowed. The global economy might be in a recession.
This chart shows firms with more than half of their sales coming from international markets had EPS fall 12.8% and revenue growth of just 0.2%. Domestically focused firms had EPS growth of 6.2% and revenue growth of 7.3%.

Recent Comments