
Hey Trader,
I get emails all the time from traders who bought at the wrong spot. One of them is down 75 on Meta.
If they’d understood the fractal reversal pattern, they never would’ve bought at that level.
A fractal reversal pattern helps you time both ends of a trade. It shows you where to get in and where to get out.
Without that timing, you end up chasing stocks. Your entries and exits get sloppy.
Today I’ll show you how to spot a fractal reversal pattern before you trade. You’ll see which charts it works best on and why you can’t read one alone.
The second people hear the word “fractal,” they want to tune out. I’ll keep this simple enough for my 12-year-old daughter to follow.
A fractal reversal pattern is a short run of candles that marks a turning point. Those turns sit right where buyers and sellers tend to show up.
I call this lesson Organized Chaos. The market isn’t as random as you think once you can see these turns.
I’ve been doing this for 39 years. Fractals really aren’t that complicated.
Let’s start with what one looks like on a chart.
What A Fractal Reversal Pattern Looks Like On A Chart
A fractal reversal pattern repeats itself over and over on a price chart. It shows up across different timeframes.
The idea started with a mathematician named Benoit Mandelbrot. He found patterns that repeat at every scale and bring order to random-looking systems.
Bill Williams adapted that idea for the markets.
Don’t think for a second a fractal reversal pattern only comes in fives. It can run three, five or seven candles.
The five-candle version is the most popular. In every size, you watch the middle candle.
On a three, that’s the second candle. On a five, it’s the third.
On a seven, you watch the fourth.
A bullish fractal has a middle candle with the lowest low. The candles on each side have higher lows, which can signal a turn up.
A bearish fractal flips it. Its middle candle has the highest high, which warns of a turn lower.
How To Spot A Fractal Reversal Pattern Before You Trade
A fractal reversal pattern points you to the spots where a stock changes direction. Those turns line up with support and resistance.
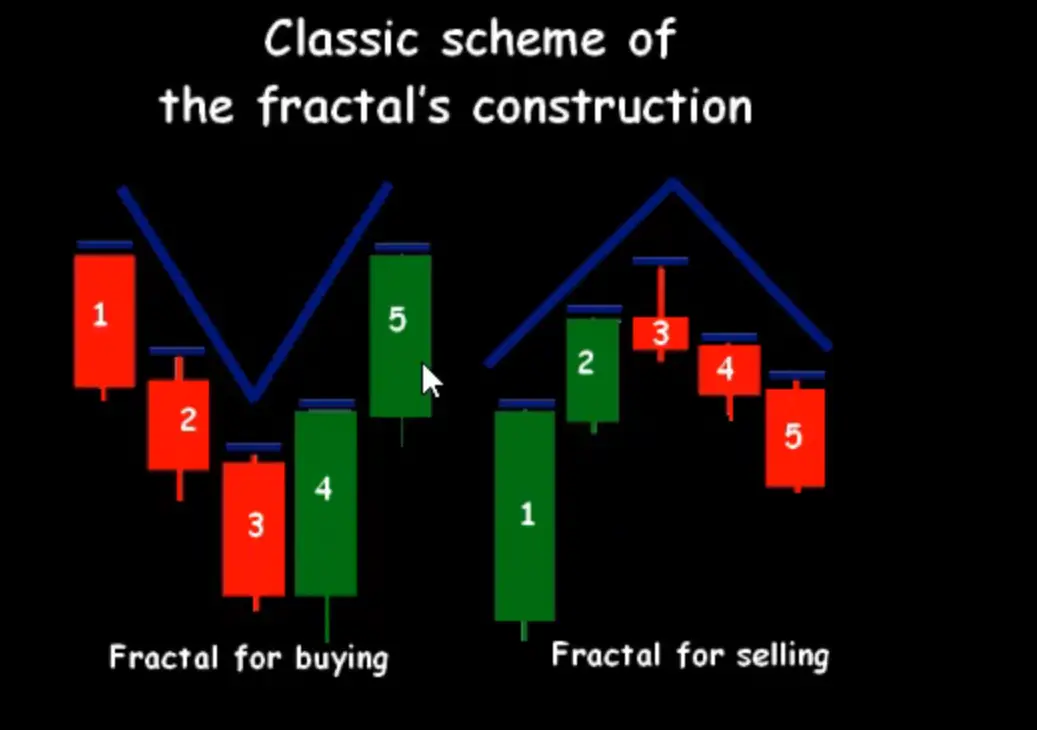
A fractal at a high often marks a ceiling. A fractal at a low often marks a floor.
Look at the S&P 500 right now. It’s stuck in a range of about 225 points.
Inside that range, I can point out three-candle and five-candle reversals. None of them are sharp, because liquidity in the index is strong.
Liquidity just means there are plenty of buyers and sellers.
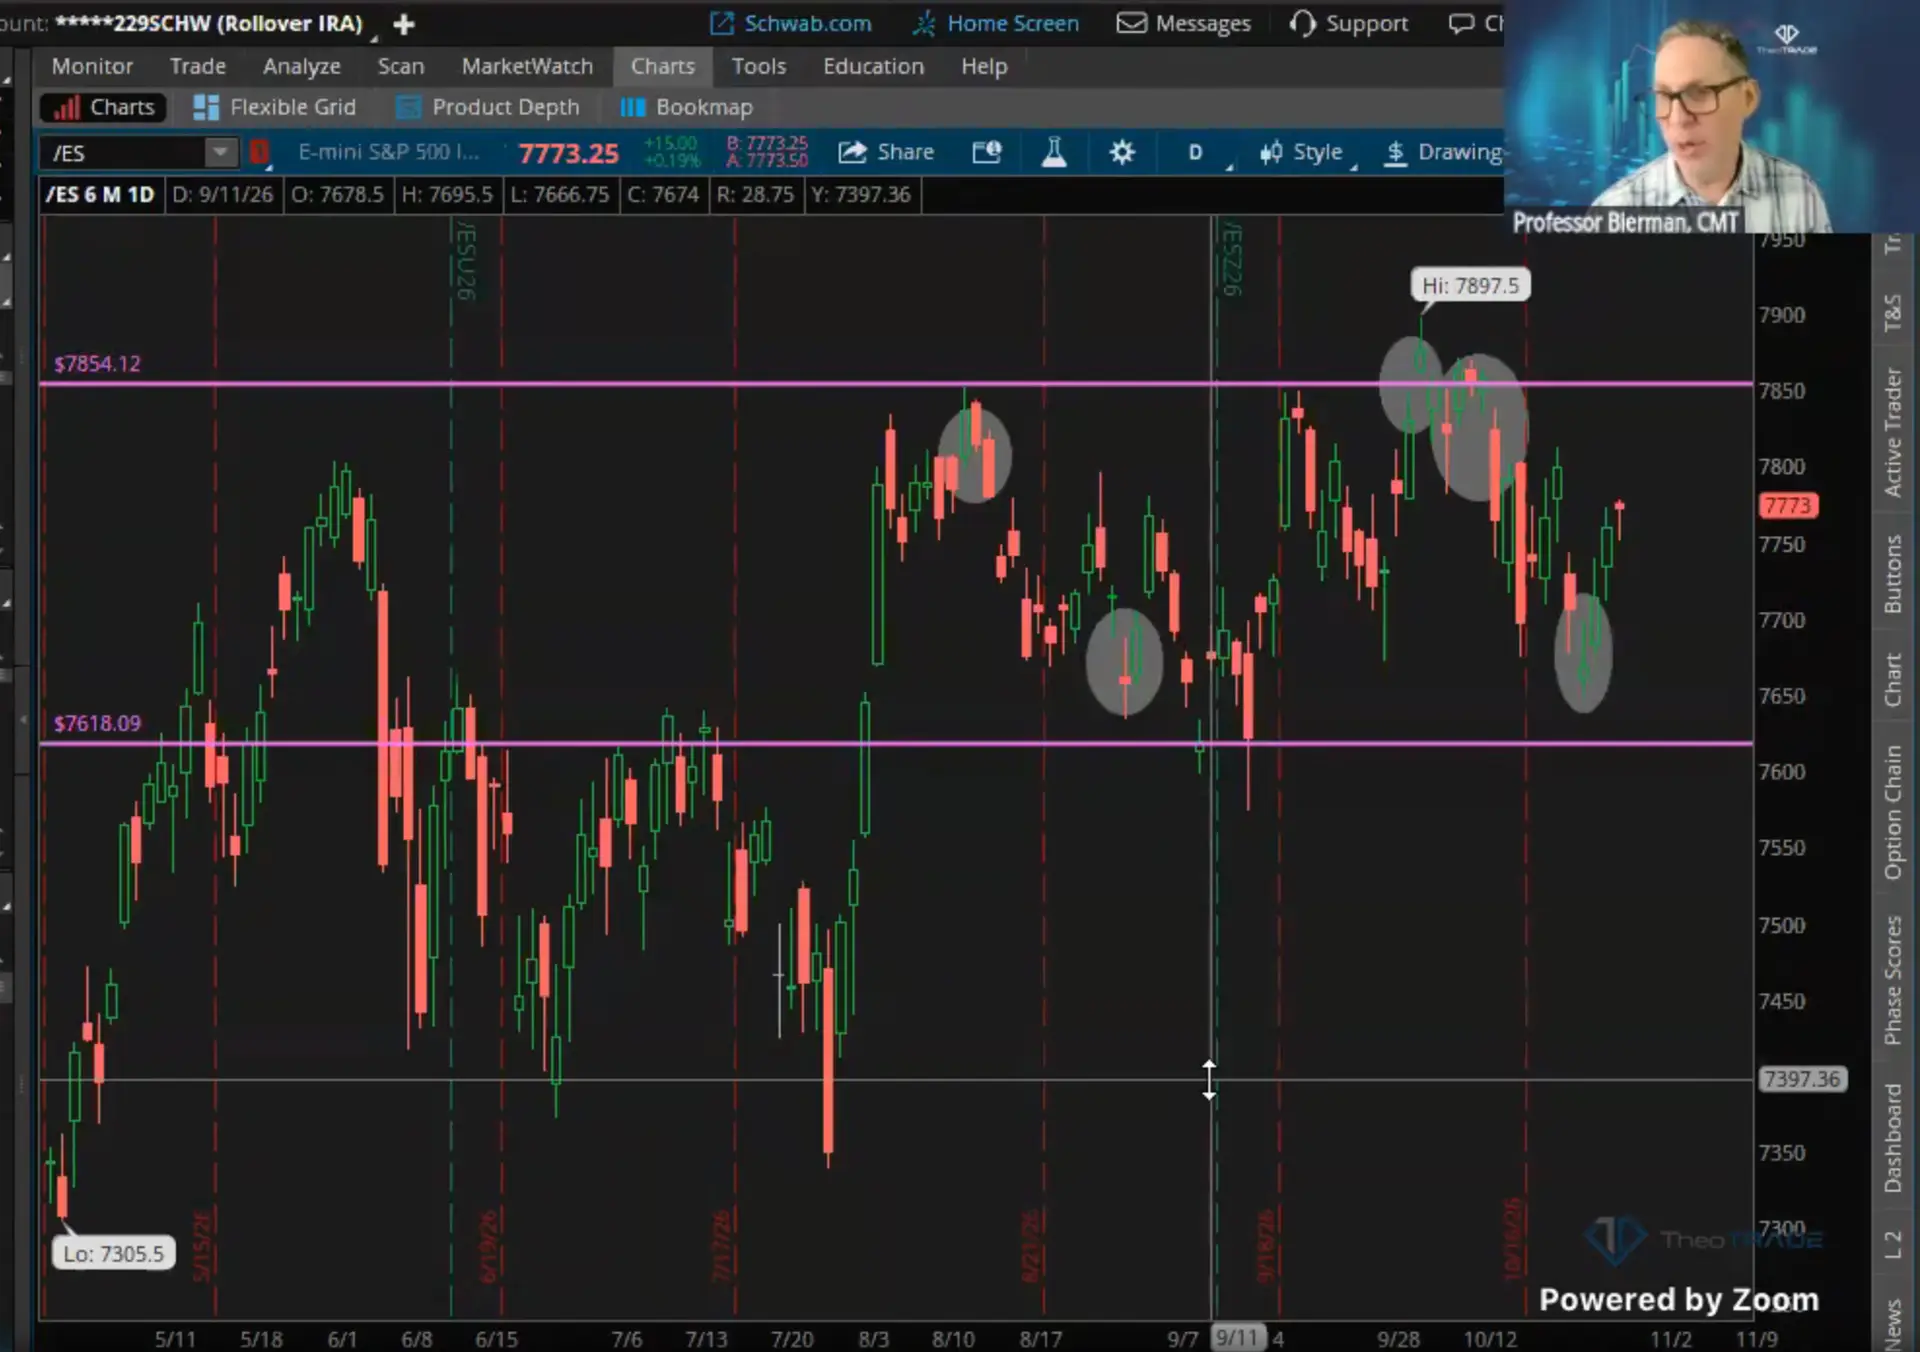
If you trade a range like this one, trade at the edges. Those edges are where the reversals form.
A fractal reversal pattern shows up two candles late. The candles after the middle one have to form before you can confirm it.
A fractal reversal pattern can also be true or false. A true fractal confirms the move.
A false fractal is a weak attempt that fails to change the trend. Watch how hard price moves after the pattern to tell which one you’ve got.
Those Meta buyers missed this read. You might not short a stock off a fractal.
You still wouldn’t buy right into one.
Sometimes a fractal’s only job is to keep you from buying.
Which Charts Fractals Work Best On
A fractal reversal pattern works intraday. It just doesn’t work as well there as on a daily chart.
A longer timeframe gives a fractal more power and better success. Even a weekly chart beats a daily.
Short timeframes give you false confidence. If you trade intraday, you’ll get even more of it.
When you’re learning to read fractals, start on the bigger charts. Look at the wide swings over about six months.
Why You Can’t Read A Fractal Alone
I’ve been doing this for 39 years. I scream at people all the time to stop using one indicator.
You need confirmation from tools that look at the market from different angles.
Say a fractal reversal pattern flashes a turn while the weekly chart still points up. The stock can keep running anyway.
That happens when the MACD, a momentum indicator, is still intact. The same goes for money flow, which tracks whether big money is coming in or out.
Any one of those can cancel the signal.
Calling a fractal the Holy Grail is nonsense. It still has a lot of history behind it.
Bill Williams paired fractals with his own alligator indicator. You can also use moving averages or oscillators to sharpen your timing.
Those extra tools help cut down on false signals. Before you act on your next fractal reversal pattern, run these four checks:
- Find the middle candle. Count three, five or seven candles. Spot the lowest low or highest high in the center.
- Wait two candles. The signal isn’t confirmed until the candles after the middle one form.
- Check the bigger chart. A fractal on a daily or weekly chart carries more weight than one intraday.
- Get confirmation. Back it up with candlesticks, trend lines, moving averages or an oscillator.
No single indicator should ever make the call for you.
I teach the fractal reversal pattern for one reason. I want you getting better timing on every trade.
I’m taking this further over the next few days. We’ll get into the alligator indicator and Polarized Fractal Efficiency.
Reading the turn takes practice. If you’re tired of buying right before one, let me show you the trades I’m taking.
That’s what my Burn Signal alerts do. Each one gives you the ticker and the signs that triggered it.
You also get a stock play and an options play. You decide how you want to trade it.
Since April 14, 38 of my 48 Burn Signal trades have been winners. Every loss had a cap I knew before entry.
The biggest single loss was $170 on one contract. Every month has been positive since mid-April.
Not one of those trades came from the Mag 7.
A hypothetical $2,000 model account taking one options contract per trade grew to $4,907.*
Three full years runs $1,990 right now, with the third year free. That price ends Monday, Nov 2 at 1 PM ET.
That’s when my Live Burn Signal Masterclass starts. Your seat comes included when you join.
Professor Jeffrey Bierman
Creator of the Genesis COG System