Hey Trader,
People tell me they can’t find a trade. I tell them to go to the heat map.
If you can’t find anything there, you’re just being lazy. There’s a trade every day.
It’s the easiest place I’ve ever found to spot a trade, day in and day out.
A heat map lays out a list of stocks as colored boxes. The bigger the box, the bigger the company.
The color shows how far each stock moved today. Bright green is way up, and deep red is getting whacked.
That color does your scanning for you. A Dow stock moves about half a percent on a normal day.
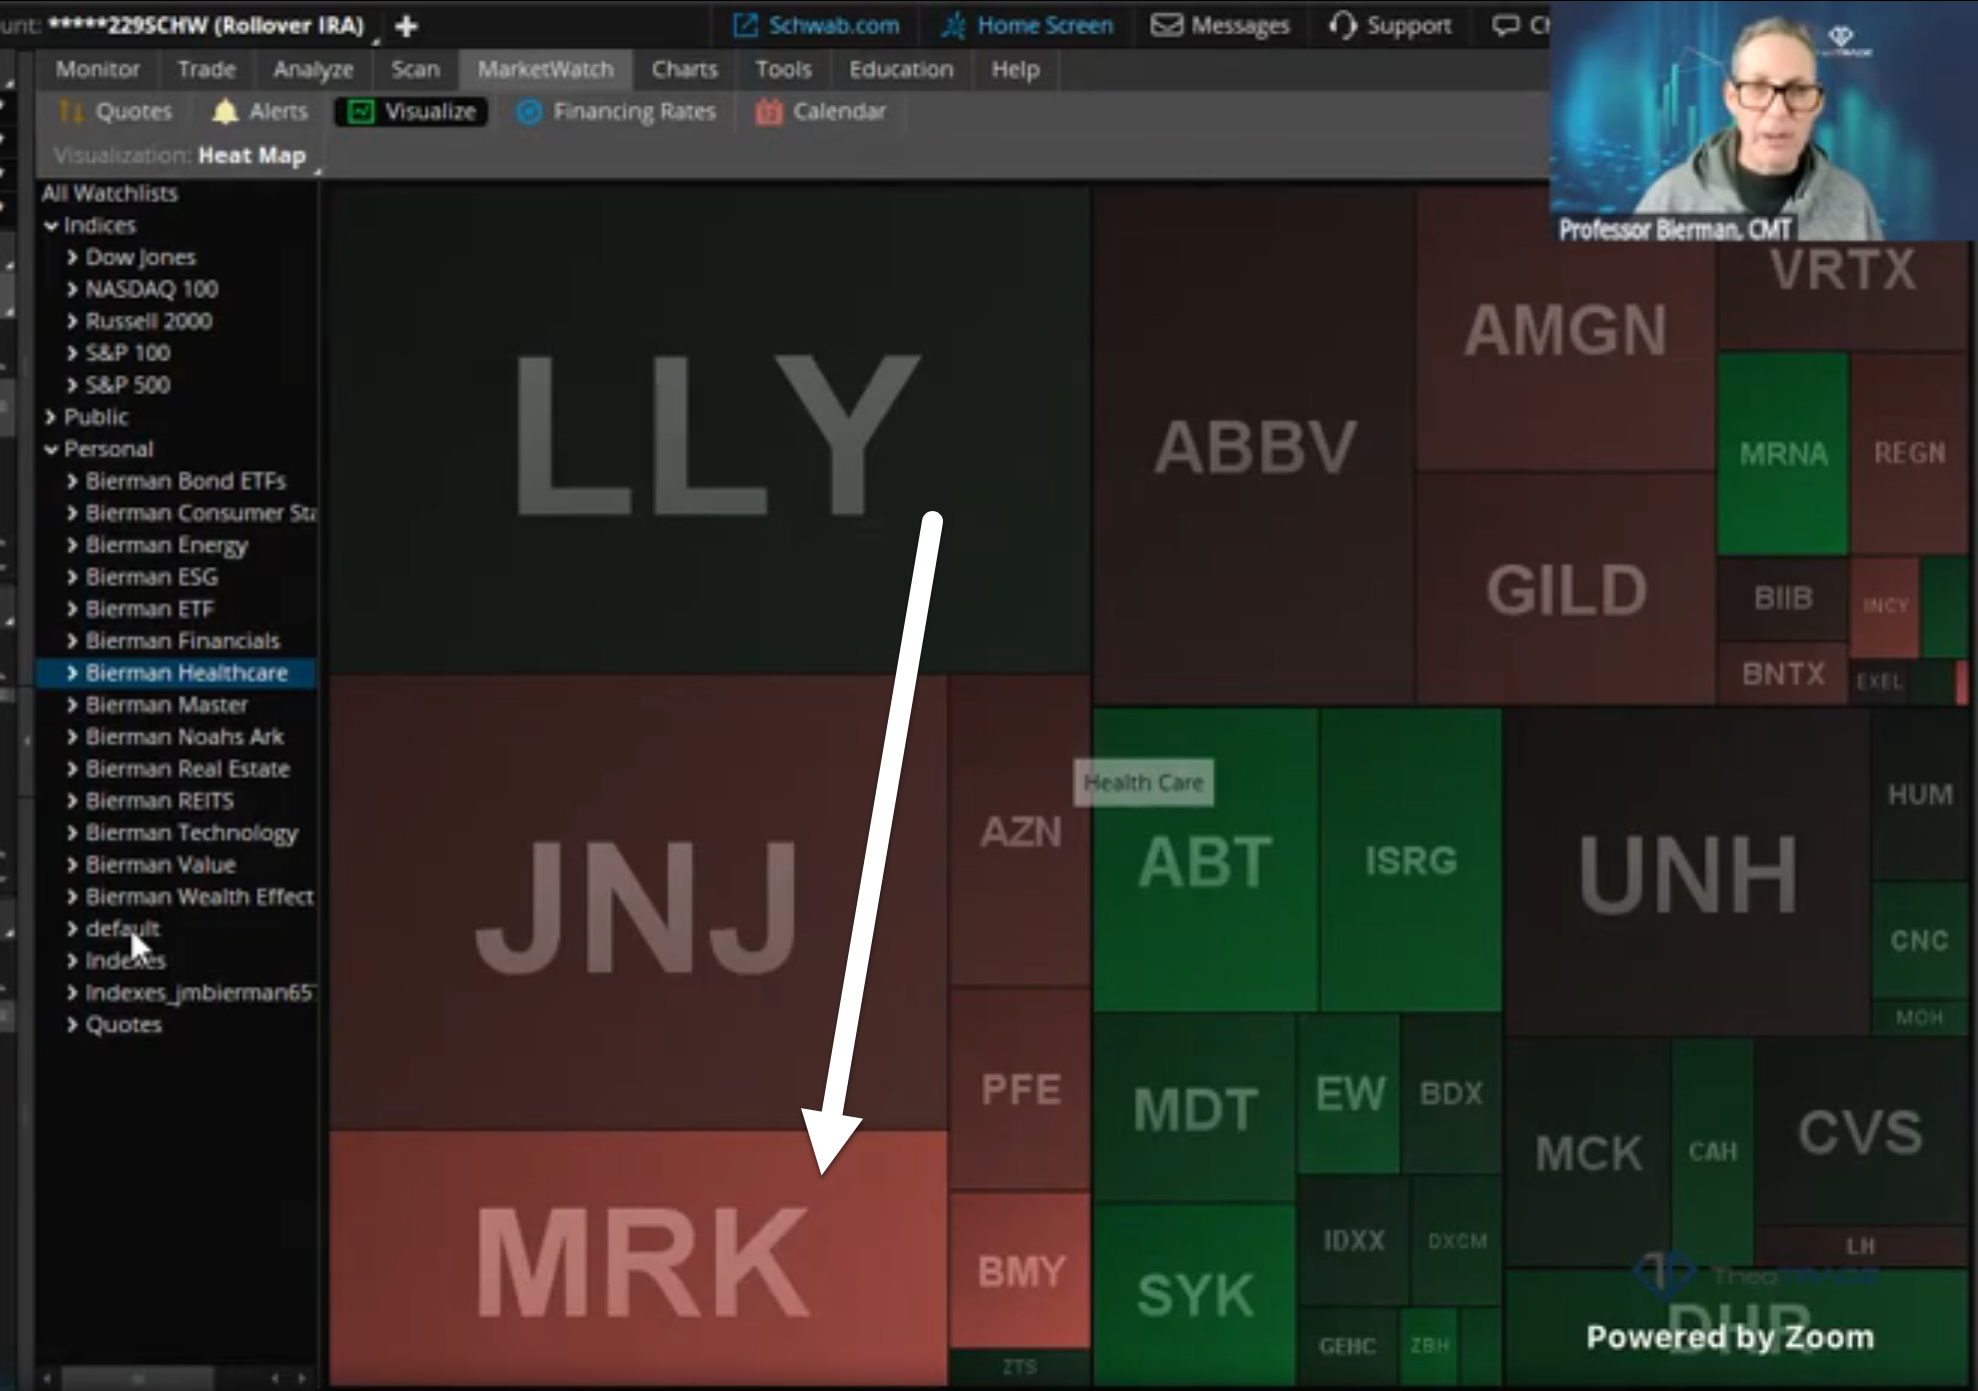
When one drops 3%, the color jumps right off the screen. Merck did exactly that today.
Without a heat map, you end up hunting through names you don’t recognize. I’d rather trade what’s familiar and liquid.
Let me show you how I read the heat map. Then I’ll show you how I cut 100 boxes down to the four I’ll trade all day.
How To Read A Heat Map
I open the heat map in Think or Swim. But you can find them on a few public sites as well. I click Visualize, then Heat Map.
Mine defaults to the S&P 100. Every company on the heat map shows up as a box in one big jigsaw puzzle.
The size of each box tracks market cap. NVIDIA gets a huge box. Intel gets a much smaller one.
The color tracks the move from the previous close. Here’s how I read it:
- Bright green means the stock is way up for the day.
- Plain green means it’s mildly up.
- Red means it’s down from yesterday’s close.
- Burning hot, liquid magma red means it’s getting whacked.
Drag your cursor over any box for the details. T-Mobile showed a $175 billion market cap, and it was down.
That’s not much of a trade. I moved on.
I’ve known about this tool for a long time. Originally, the heat map came out of thinkorswim, and Don and I were there.
Tom Sosnoff’s programmers built it. His idea was simple: show traders blood red and Granny Smith green, and they’ll keep trading.
Why A 3% Move Jumps Off The Board
A Dow stock moves about half a percent on an average day. Anything moving 2% or 3% is almost an automatic trade candidate.
I clicked into the Dow heat map today to show you. Google was up 0.43%, and Amazon was down about a fifth of 1%.
Apple was virtually flat. NVIDIA was up 1.34%.
None of those were trades. Then I saw Merck in deep red, down 3.53%.
You don’t have to worry about liquidity there either. Walmart, Coke and Procter & Gamble all run above $250 billion in market cap.
Familiar and liquid go hand in hand on the heat map. I’m all about familiar.
If the Dow bores you, switch to the NASDAQ. It carries a lot more volatility.
Why I Only Want Four Bright Boxes
Too much color is a bad sign to me. I’d rather see three or four bright boxes on the whole board.
All I want is four out of 100. I can focus on four stocks all day long.
From there, I’ll trade a 0DTE option. I’ll also trade the stock itself in 10 or 15 shares.
Keep in mind what the heat map won’t do. It won’t tell you to buy, and it won’t tell you to sell.
That call rests on you. You have to know whether you buy strength, sell strength or trade contrarian.
The color tells you where to look. Your system decides what you do there.
Build Your Heat Map Around What You Trade Well
The Russell 2000 gives you 2,000 boxes. That’s a headache.
You can load any public list on the platform instead. You can also load your own watch lists.
I built mine myself. They include Bierman’s Noah’s Ark, Bierman Master and Bierman Healthcare.
Healthcare had a rough day, so I pulled that list up. Merck was down 3.58%.
Bristol Myers was getting hit too. Stryker was up 3.3%, which made it a possible bullish trade on the same screen.
My tech list showed CRM down 3%. Cloudflare was up 4%.
There’s always a trade somewhere, bearish or bullish. You just have to stick to what you’re good at.
I’m not very good at trading biotech. You won’t find any biotech on my lists.
Here’s how to run this tomorrow morning:
- Open the heat map and load a list of names you already know.
- Look for three or four boxes moving well beyond a normal day.
- Run those few names through your own trading system before you commit.
That third step decides whether the trade pays you. A heat map hands you the candidates. It can’t make the decision for you.
The Genesis COG System gives you a complete methodology for making that decision. The Genesis Cog Scanner adds real-time signals on top of it.
Put them together with the map. Every bright box then gets the same disciplined check before your money goes in.
Enroll in the Genesis COG System
Professor Jeffrey Bierman
Creator of the Genesis COG System