Hey trader,
An institutional hedging signal I keep on my screen went off on August 6.
All it tracks is how much large institutions are paying to protect themselves from a drop. When they get nervous, that price climbs.
I didn’t act on it that day. I wanted to see how the options market was positioned first.
By August 13, that reading was the highest it had been since December 24 of last year.
That’s the part I don’t love. Last Christmas Eve, the market slipped only 1.68% at the time. Nothing looked broken. The correction that eventually showed up took 9% off the market.
We’re down 2.5% right now. So what does the rest of that math look like?
The measure takes two symbols and a single line on a chart.
I’ll walk you through the level that matters, then show you what happened the last four times it fired.
The Institutional Hedging Signal in Two Symbols
The setup is simple. I plot 3M plus VIX as a composite symbol, then run a basic pairs ratio study on it.
The three-month VIX tells you what traders expect volatility to be about 90 days out. Spot VIX covers the next 30 days.
When that longer number climbs well above the shorter one, institutions expect trouble further out. They’re paying up for it right now.
My line sits at 1.2. On August 6, the ratio popped above it.
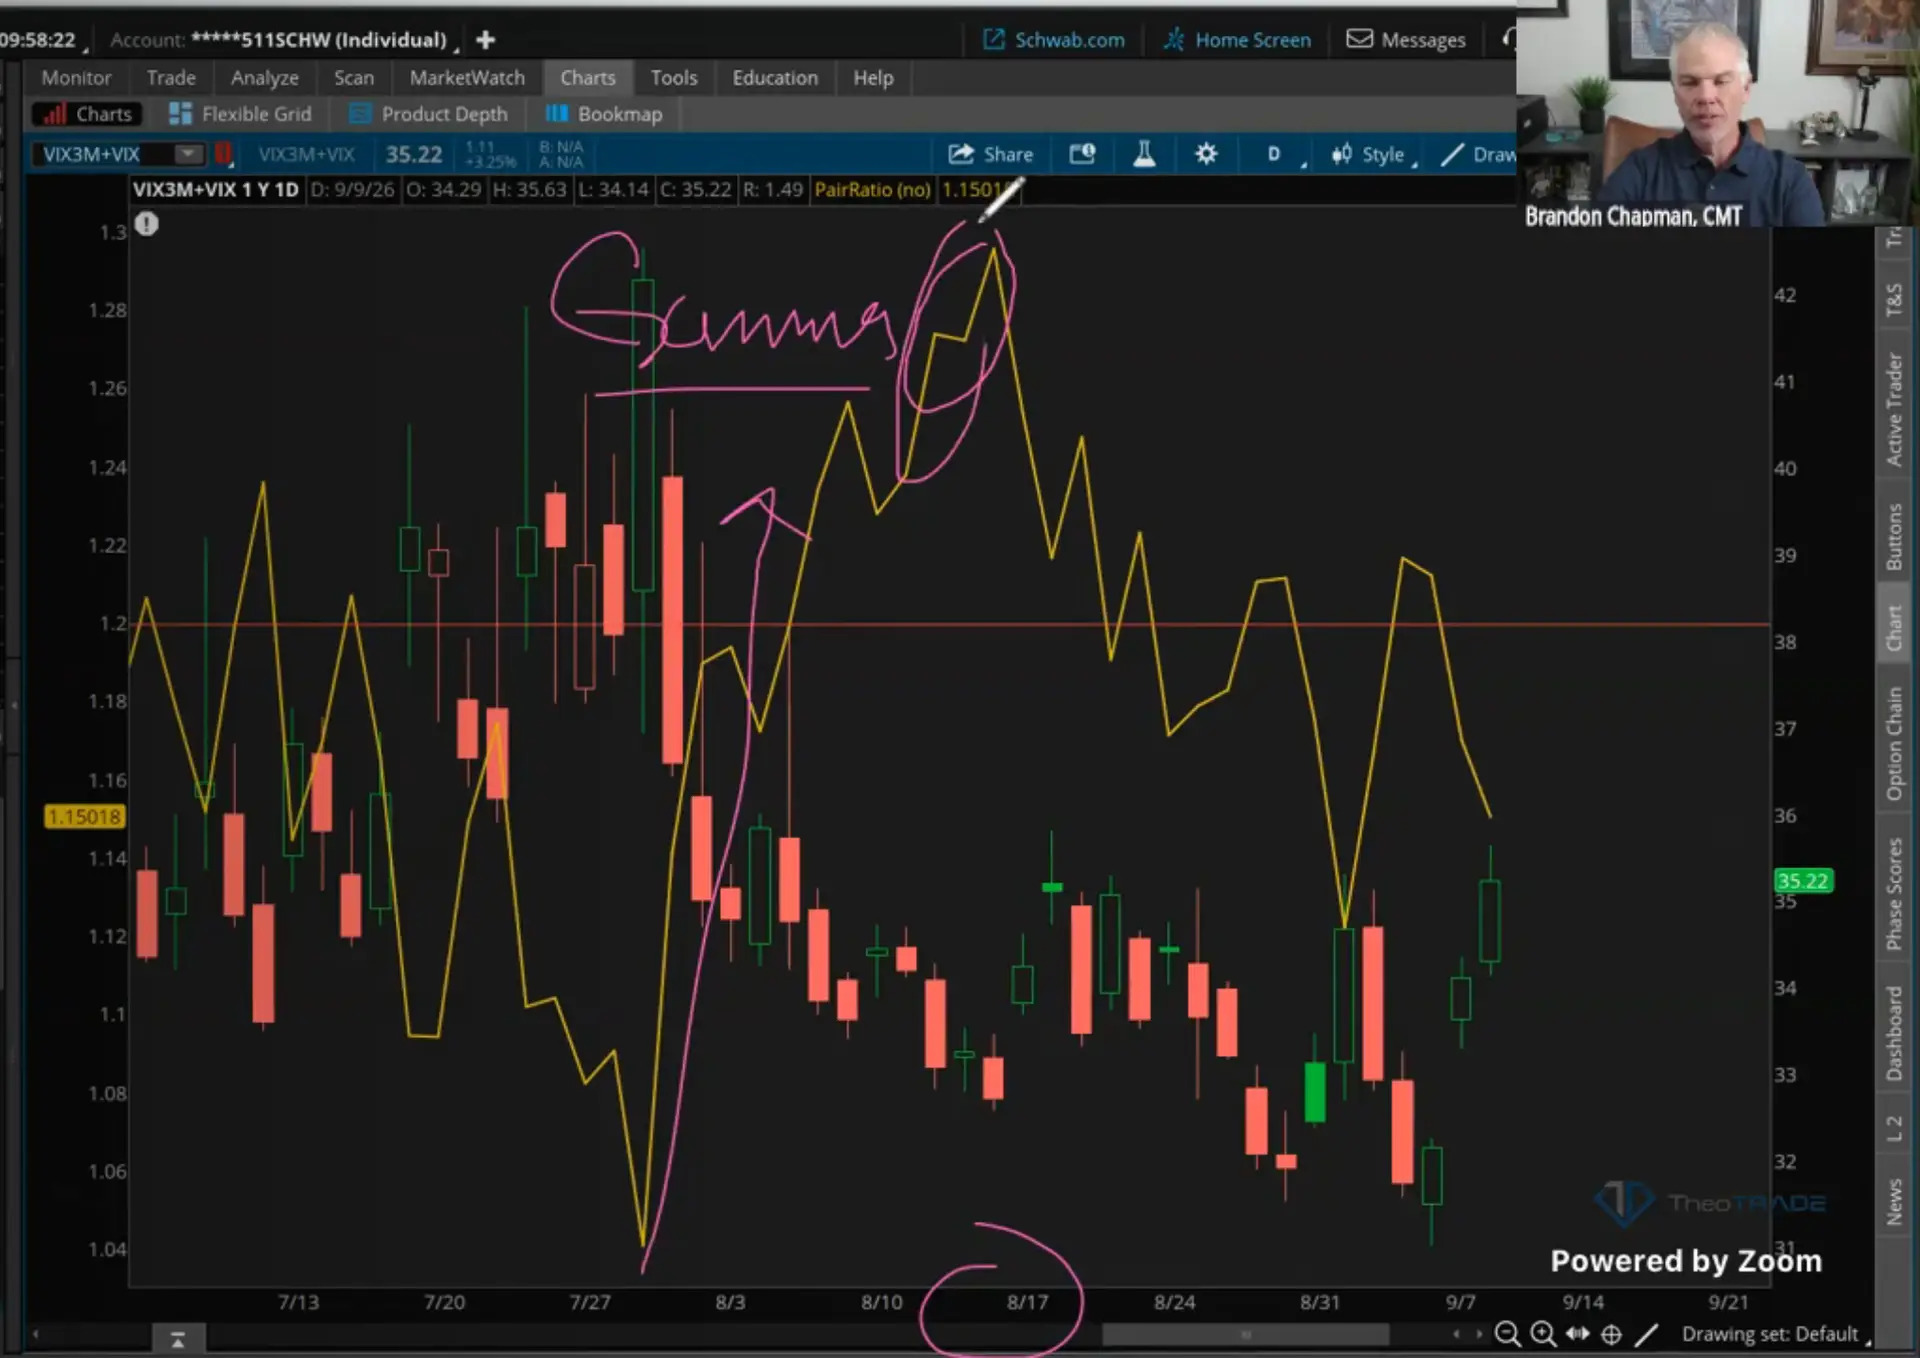
Skew moved the same day. It dipped below 130 and came right back above it. Skew climbs when institutions hedge.
Here’s what trips people up. The VIX itself was falling while skew rose.
Institutions sell calls and buy puts at the same time. Selling those calls drags the VIX lower.
Buying the puts steepens the curve underneath it. A quiet VIX told you nothing useful in August.
What Happened the Last Four Times
By August 13, that ratio hit its highest reading since December 24 of last year. It ticked higher again the following day.
Go back to Christmas Eve and watch what followed. The market gave up 1.68%, then went quiet.
Anyone who hedged that day looked wrong for weeks. Volatility kept expanding the whole time.
It expanded until it broke. The correction eventually measured 9%.
October 27 fired the same signal. Roughly a 4% decline followed that one.
December 3 gave up about 2% at first. That reading still turned out to be the sell point, because the 9% arrived after it.
There’s a fourth I keep in mind. The ratio popped back above 1.2, then the real selling held off for about a month.
None of those four paid immediately. Each one marked a stretch where the market stalled out and pulled back inside the next 30 days.
Taking profits on any of those dates wasn’t a bad decision.
What I Do With the Reading
I waited after August 6 because I wanted the options positioning to turn more bearish first.
It turned over the three sessions into mid-August. The put/call ratio flipped, with institutions buying puts faster than they were selling calls.
That build adds selling pressure as those puts move toward the money. Institutions weren’t only paying for protection at that point. They’d built a structure that makes declines worse.
Once I get a signal, I assume a 5% to 10% move. I use the same number every time.
I’m not calling for anything here.
The upside stopped paying me for the downside risk I’m already carrying. I put that at roughly two to one over the next 30 days.
That means being early on purpose.
Last week I supplemented with a VIX call spread. A vertical is one option bought and another sold above it, which caps both the cost and the payout.
- Setup: long the VIX 16 call, short the 18 call
- Cost: 30 cents, which is also my maximum risk
- Target: a dollar, though I’d prefer $1.50
- Edge: closing it at a dollar pays for the 19/24 spread I already own
It’s trading between 66 and 69 cents today. That’s better than 100%.
Where That Leaves Us Now
Skew dipped yesterday to 148. Forward volatility expectations are still the most extreme I’ve seen since Christmas Eve.
Institutions have been hedging aggressively the whole way down. The vol market has been telling you that for weeks.
We’re down 2.5% from the highs. My working assumption calls for 5% to 10%, so most of that range sits in front of us.
That isn’t a forecast. When institutional hedging peaks like this, markets frequently stall out and frequently see some kind of pullback inside 30 days.
The 20% version is a different conversation. If I believed a real bear market was starting, I wouldn’t hedge at all.
I’d sell my longs instead. No hedge absorbs a decline that large.
Hedging also costs more today than it did in August. The VIX near 17 raises the price of protection, and back month options have been expensive since last October.
Everything you’d want in place now should have gone on back in mid-August. That’s what waiting for confirmation costs you.
Take the Next 90 Days Seriously
Reading institutional hedging isn’t a one-time exercise. The signal fired on August 6, and I’m still managing positions around it a month later.
That’s the part a single article can’t give you. You need the plan in front of you when the reading changes.
Inside Block Hunter, the atomic hedge plan sits in the library alongside 13 other trading plans for different strategies. I send two to three alerts a week, and we work through the positioning live in the Mastermind sessions.
The Block Hunter 90 Day Challenge gives you a defined window to put all of it to work.
Ninety days is enough time to see a signal fire, place coverage while it’s still cheap, and manage it through whatever the market does next.
Brandon Chapman, CMT
Creator of Ghost Prints