Santa Clause Rallies Don’t Happen As Often As They Used To
Stocks indexes were down slightly on Tuesday because of AAPL. Apple fell 2.54% because of reports of weak demand for the iPhone X. If the iPhone X sells badly, the company will shift its focus to lower priced products like the iPhone 8, hurting margins. It is questionable if Apple will continue to be able to ship phones with large bezels like the iPhone 8 and 8 Plus next year at high end price points. The firm may have bit off more than it can chew because most high end phones have bezelless displays. It has become a must have feature instead of an add-on feature which some consumers pay up for.
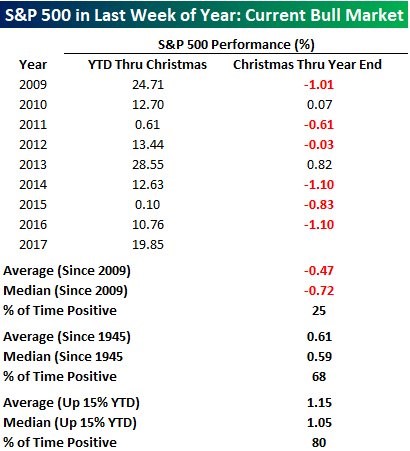
Even with AAPL’s selloff, the S&P 500 was only down 0.11%. If you look at the chart below, this performance was normal for the last week of the year in this bull market. Since 2009, the stock market has only been up 25% in this week. Usually, stocks are up this time of year especially when the market is up 15% or more. One hypothesis I have for why this has changed is that the algorithmic trading functions don’t care about holidays. For most of the history of the market since 1945, this week is when young traders get a chance to shine while the experienced ones take off. Now, the computers running the show don’t take off during the holidays, so trading doesn’t have an upward bias.
This Cycle Will Probably Be The Longest Ever
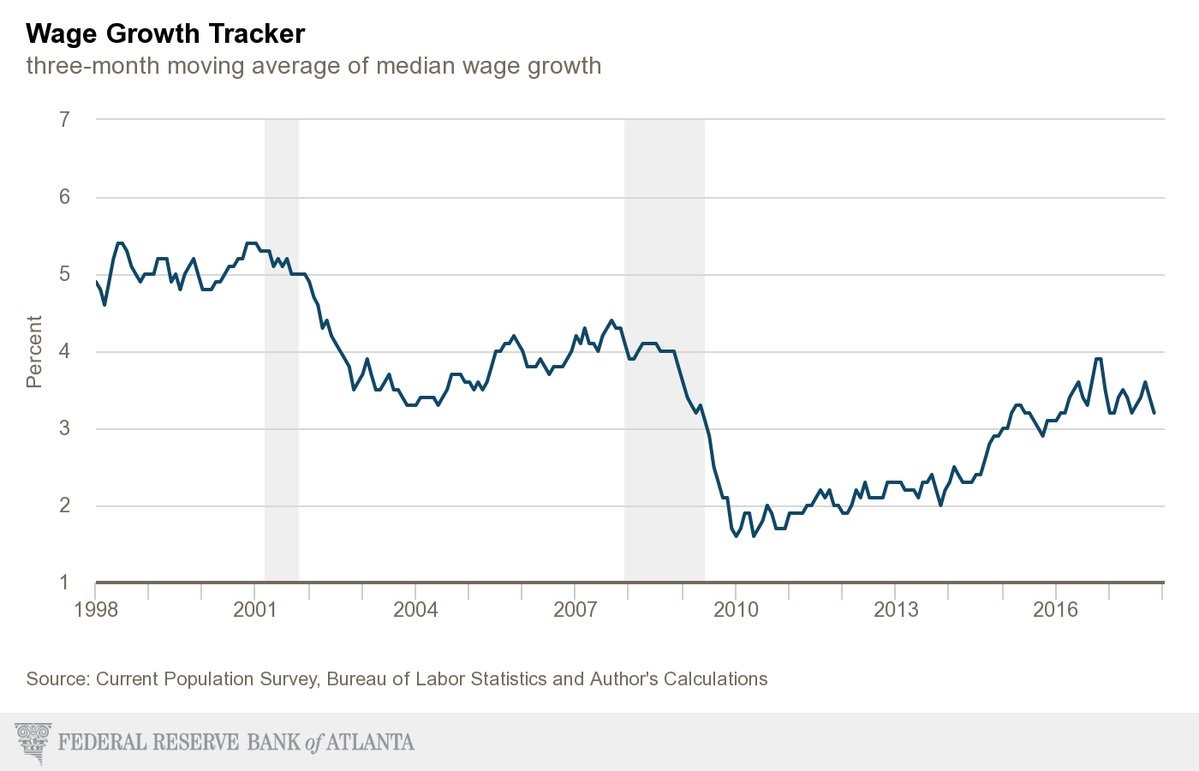
This expansion is the 3rd longest since 1854. With early 2019 being the date when it is the longest expansion, it’s not a tough call to say this will be the longest expansion. This expansion has confounded many economists and investors because it’s tempting to think the economy can fall into a recession when it’s growing so slowly. With economic growth between 1.6% and 2.6% per year, it’s easy to see growth falling a bit and the economy having a recession. However, that’s the exact opposite of reality. Because growth and inflation have been so low, the Fed and the government are encouraged to provide monetary and fiscal stimulus which help prevent a recession. It has been a Goldilocks situation for stocks and those wanting to avoid recessions. According to the output gap and the yield curve, the economy has a couple more years before a recession. The key negative effect of this weak growth is low wage growth. As you can see, the latest data point from the Atlanta Fed wage tracker is bad news. The wage growth in November slowed from 3.4% to 3.2%. It has been in the 3-4% range for the past 1.5 years. It probably will push higher next year.
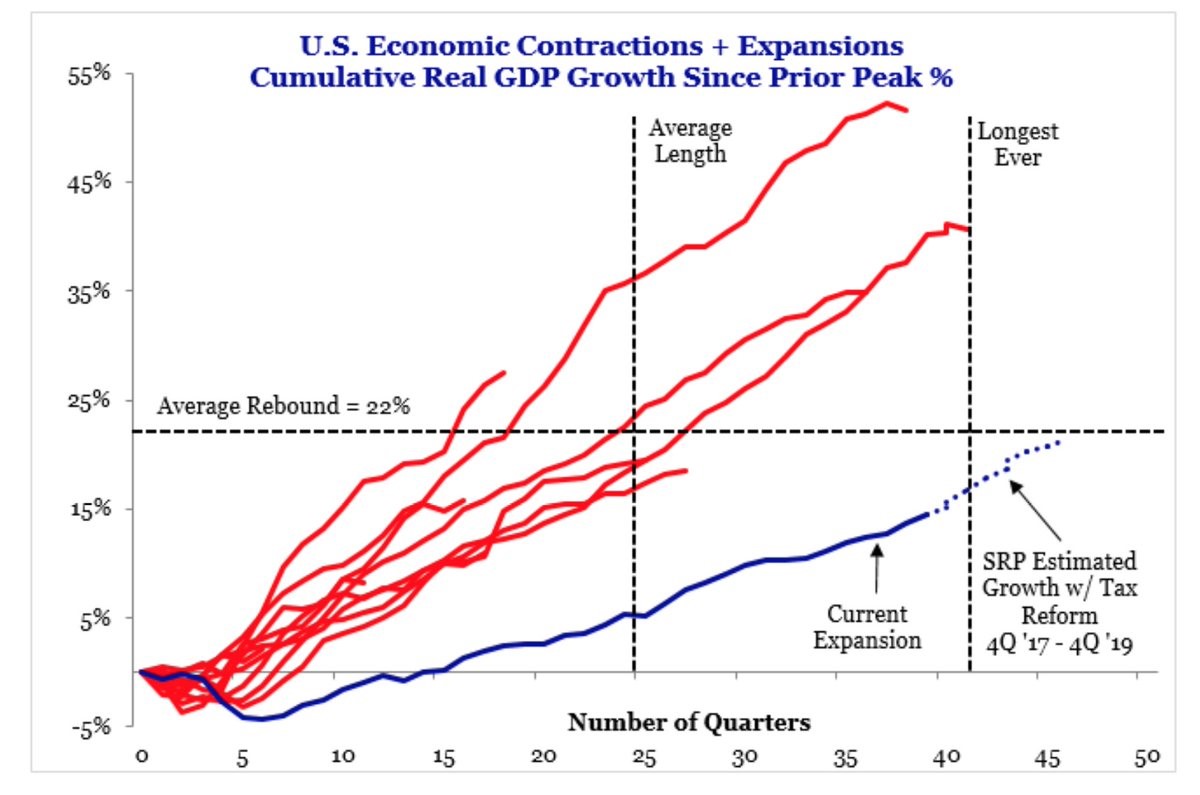
The chart below shows the current cycle compared to previous cycles. As you can see, the current expansion has the lowest rebound percentage even though it is closing in on being the longest. It would take until 2020 to get to the 22% mark if you include the implied acceleration because of the tax cut. This means it wouldn’t be shocking if this cycle is the longest. Another aspect to consider is whether this cycle being the longest ever means the next recession will be especially bad. On the one hand, more debt has been accumulated. On the other hand, the economy had a lot of slack to make up from the last recession which was the worst since the Great Depression. The biggest aspect to consider is if inflation increases a lot. I think it can increase cyclically because of increased emerging market demand for commodities and the tight slack in the American labor market. However, it’s tough to imagine a secular increase in rates and inflation because the demographics, which show slower population growth in the developed markets, imply inflation will stay low. That would mean we won’t see a bad recession when it happens, but it all comes down to what catalyst drives the recession.
Since we don’t know what will cause the next recession, we can’t say for sure how bad it will be. The other possibility which is very dreary is that there aren’t major recessions, but the millennials never improve their standing compared to baby boomers because of the indentured servitude that are student loans. Personally, I think this huge debt load will lead to the next generation not taking out huge loans for college which means it’s not a never ending cycle of despair. However, millennials are having fewer kids than baby boomers which will further limit economic growth.
Commodity To Stock Ratio At An All-Time Low
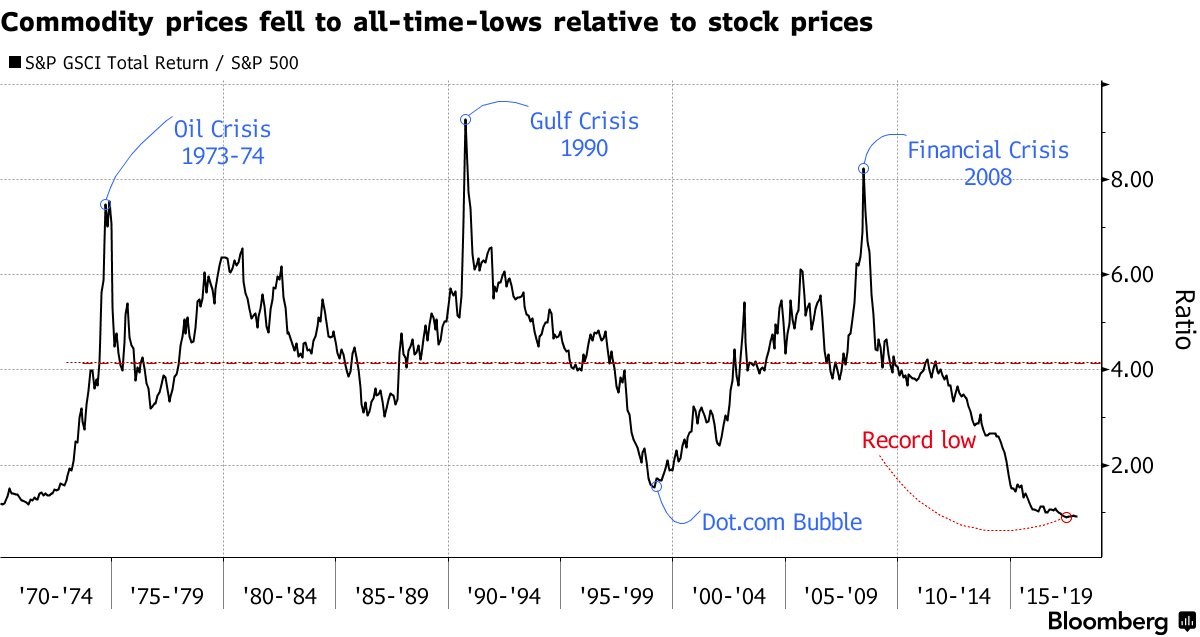
As I mentioned, low inflation has helped this economy have the third longest expansion. As you can see, the commodity price to equity price ratio is at a record low. Stocks are at their all-time highs while commodity prices have been stagnant. As you can see, oil has been the key factor which has driven this index in both directions. Oil prices spiked along with fertilizer prices in 2007 right before the financial crisis, pushing up the index and giving stocks another catalyst to crash. Oil prices crashed in late 2014. Although they have increased in the past 12 months, stock prices have increased, keeping the ratio falling. Be careful not to use this chart to support a thesis which says to sell stocks because they are more expensive than ever before. This is just for informational purposes.
Conclusion
It’s interesting to see that this week might see moderate weakness, but, in the end, this will be considered a great year even if stocks fall. The story of the beginning of 2018 will be how good the retail sales were. It looks like investors are worried about iPhone X sales. If Apple reports a weak quarter, the repatriation tax holiday and tax cuts won’t be able to prevent the stock from falling sharply. This holiday season was likely the final straw for some of the struggling brick and mortar stores. We’ll hear about a new round of bankruptcies from them next month.
Recent Comments