
Hey trader,
Exit decisions made under pressure turn into guessing.
Traders stare at the screen, hope for one more push, then watch the profit drain out.
But you don’t always have to take it lying down.
We’ve all seen data releases move the markets. Holding through one can turn your healthy profit upside down in a heartbeat.
Calendar events give you time to plan, prepare, and execute.
You can MANAGE risk instead of letting it manage you.
Tuesday morning I was long a gold channel trade with the 10:00 Eastern JOLTS release nine minutes out.
I gave the position one condition to meet.
It failed the test.
I limited out at 4408 and kept $120, then watched gold drift right back down to my exit price.
Knowing how to handle these events is critical to successful trading.
Today, I’m going t walk you through how I did just that. You’ll see the conditions I set to determine whether to stay with the trade.
Then we’ll walk through the adjustments I made to lock in profit and walk away before things got crazy.
Known Risk Has a Timestamp
Every session hands you two categories of risk. The first arrives without notice.
A headline drops. Nobody plans around that.
The second category shows up on the economic calendar with a clock attached. Tuesday morning brought the Job Openings and Labor Turnover Survey at 10:00 Eastern, alongside ISM Manufacturing PMI.
JOLTS has jolted us right out of trades with slippage before. It has also produced nothing at all on other days.
The uncertainty is the problem. You cannot manage around a number nobody has seen yet.
The Position I Was Holding Into It
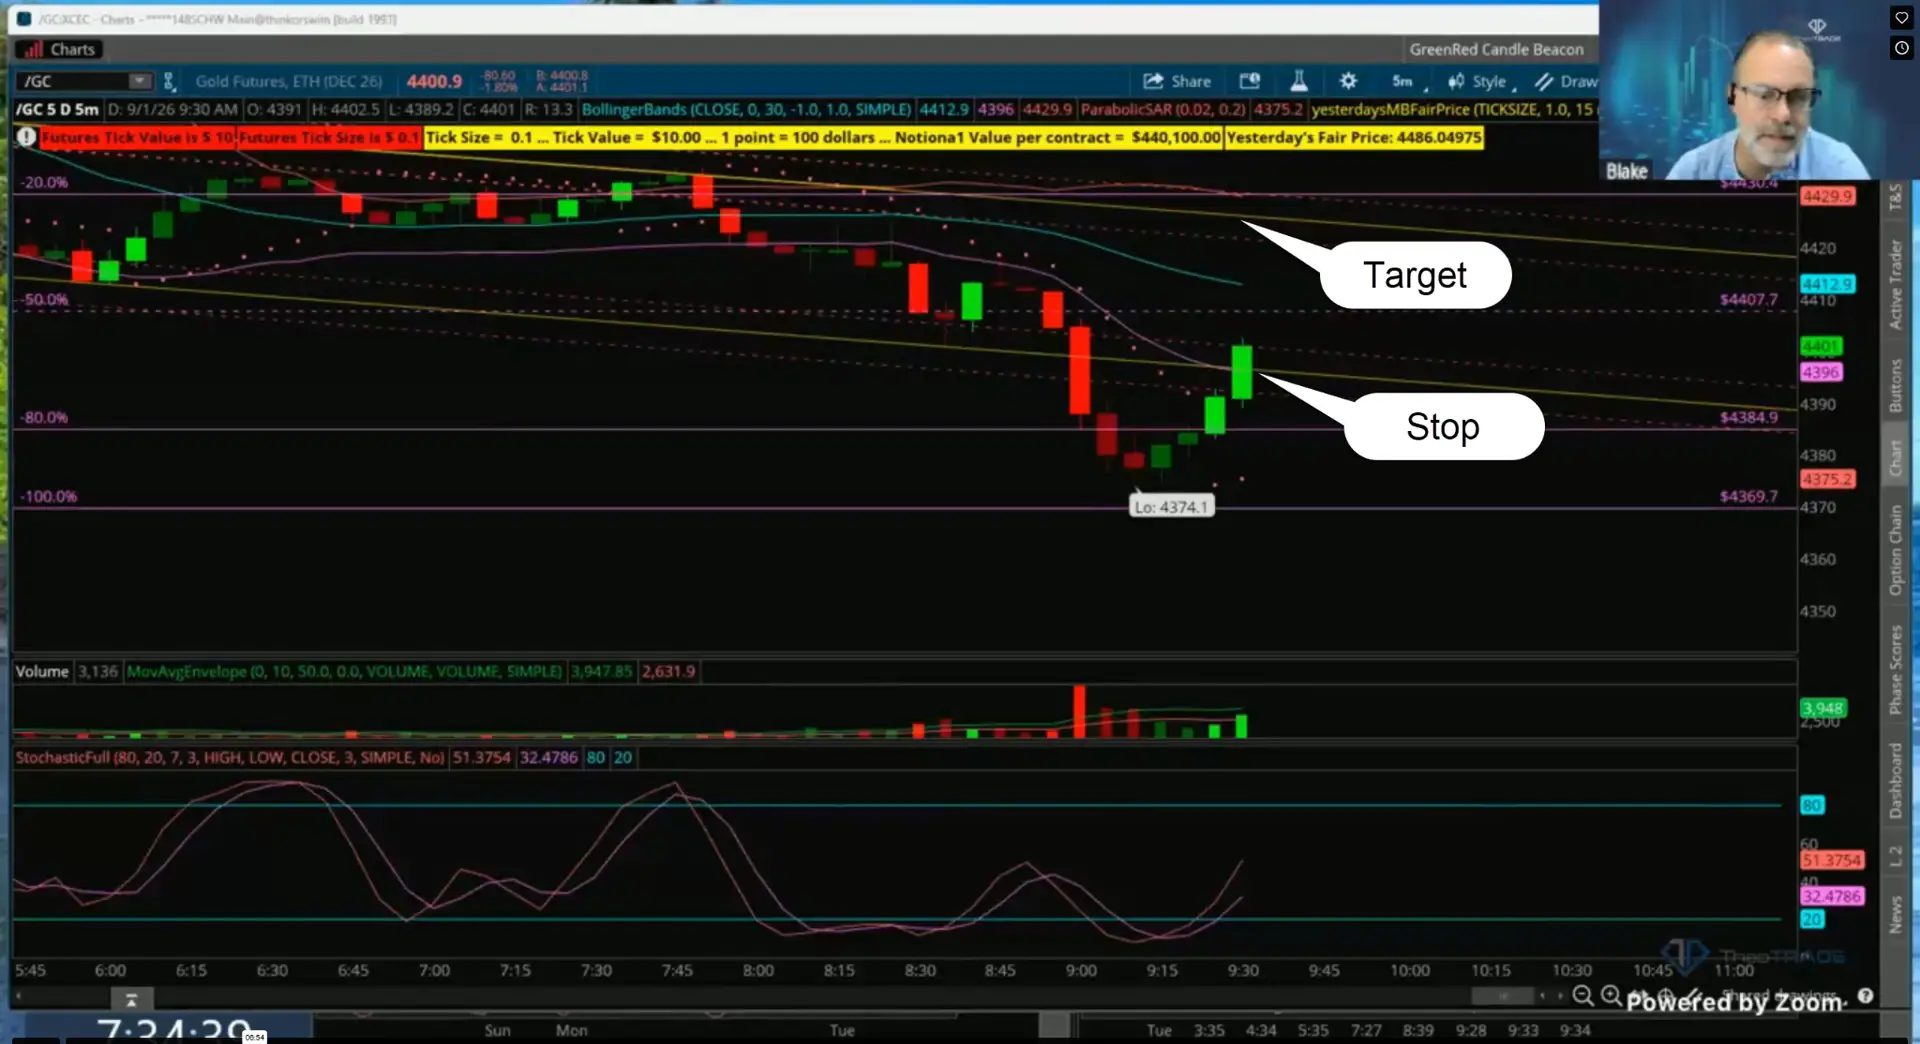
I was long the December gold contract from 4396 on a channel breakout. My stop went below the low at 4387.
The target sat at 4424, worth roughly $280 on a single contract. Position sizing runs one contract per $5,000 of account.
Gold moved my way. Once price traveled past the halfway mark of the channel, I pulled the stop up to 4396.
That number came from the structure of the breakout. Anyone filled at a better price still used 4396, because the channel sets the level.
The Warning That Showed Up First
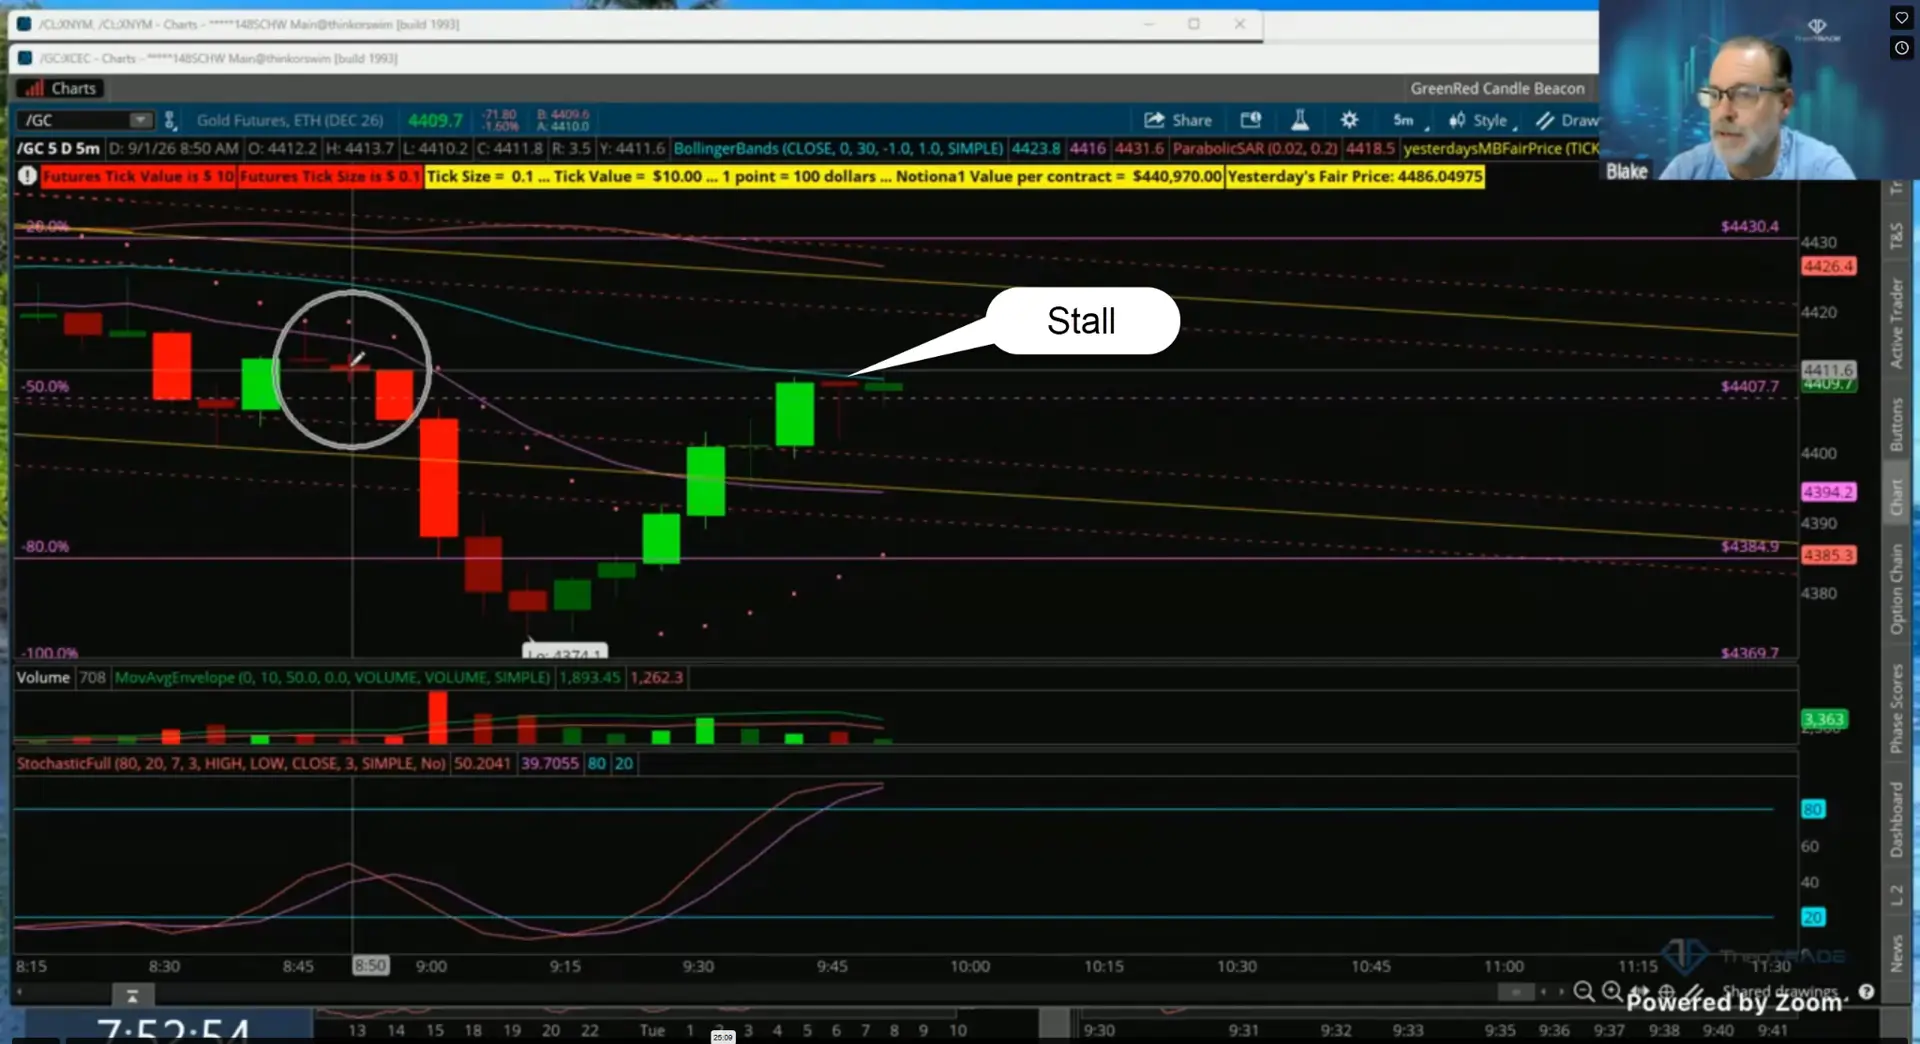
Price stalled underneath my target. The indicator kept printing higher highs while price printed lower highs.
That disagreement is a hidden bearish divergence. It says price wants to travel back down to the low that started the move.
I had that warning sitting on the chart with a data release nine minutes out. Two threats stacked onto one open position.
My open profit was already in hand. The target still needed a push that price kept refusing to give.
The One Condition I Gave The Trade
I did not close on feel. I gave the position a single test to pass.
Price had to close above the 30-period moving average on that candle. A close above it would break the divergence threat and open the path to 4424.
A failure meant I pulled the trade off at 4410. The condition existed before the candle finished, not after.
That sequence matters. A rule set in advance removes the argument you would otherwise have with yourself at the worst possible moment.
Price printed a close near 4411.8 and went nowhere. The next candle rolled over and never closed through the level.
The test failed. I stopped negotiating with the position at that point.
How I Actually Got Out
Market orders during a data print pay whatever the book is offering. Slippage takes the profit right there.
I placed a fresh limit order at 4408 instead. Price needed one small blip higher to fill me.
It touched 4408 and I was out. The fill paid $120.
Then I cleaned up the platform. I still had a stop and a target resting from earlier, and I clicked exit cancel until nothing was left working.
That last step gets skipped constantly. An orphaned order turns a closed trade into a live position you forgot you had.
What The Report Did
JOLTS printed worse than expected and better than the prior reading. Manufacturing came in worse than expected and worse than last time.
The market called it mixed and moved on. Gold drifted right back down to the same price where I exited.
My son was out flying at night for his instrument rating. We like to say we would rather be on the ground wishing we were flying than in the air wishing we were on the ground.
Trading runs on the same logic. I would rather hold $120 and wonder about the extra hundred than watch a good trade go red through a data spike.
What This Means For You
None of this requires a new indicator. It requires a decision made before the clock forces one on you.
- Mark the release before you enter. Check the calendar for your session, note every release time, then ask whether your target is reachable before the print lands.
- Write the exit condition while the trade is still working. Pick one observable event, like a candle closing above a moving average, and let that single test decide the trade.
- Exit with a resting limit order. Place it a tick or two above where price sits, let a blip fill you, then cancel every leftover order on the platform.
Run those three in order and the exit stops being emotional. It becomes a checklist you complete while the trade is still green.
Your Next Step
You can build this habit alone. It takes a lot longer.
Inside the 10% Club, I call the level, the condition, and the exit out loud while the trade is still open. You see exactly what a data release does to a live position, and what to do about it.
That process delivered 453 winning trades in year one. Eleven winning months out of twelve, and a $5,000 account turned into $14,459 in net profit.
Tomorrow morning has its own calendar. Come sit in the room and watch the plan get made before the print lands.
TAKE YOUR SEAT IN THE 10% CLUB
Blake Young
Senior Market Strategist, TheoTRADE