Jobless Claims Spike
Bears may have gotten excited by the spike in jobless claims, but it is irrelevant. It doesn’t mean anything bad is happening to the economy. Especially just because a few states including the large states of Pennsylvania and California estimated their results. If results are estimated, they can be incorrect.
We will have this sorted out in a few weeks. I’m guessing there isn’t a problem with the labor market. Even so, the spike in claims wasn’t dramatic.
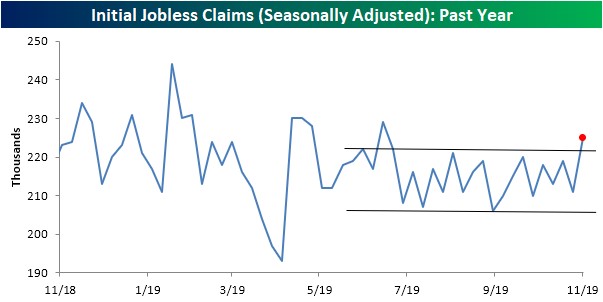
As you can see from the chart below, the number of claims increased 14,000 to 225,000 which was above estimates by 10,000. Claims being estimated means there might not have been an increase, but even if there was, it’s not much cause for concern. We need to see the 4 week moving average increase above 270,000 to forecast a recession. 4 week average only increased from 215,250 to 217,000. Continuing claims stayed low as they were 1.683 million and the 4 week average was 1.688 million.
Weak PPI Inflation
PPI inflation rate measures the changes in producer prices. It is ahead of consumer price changes because producers buy raw materials and sell the final products to consumers. PPI reading is supposed to lead CPI. If that happens, CPI and core CPI will fall just like the recent charts predicted.
Specifically, headline yearly PPI was 1.1% which beat estimates for 0.9%, but fell from 1.4%. The chart below shows it has been in a downtrend for about a year. PPI excluding food and energy was 1.6% which matched estimates and fell from 2%. It’s below the all important 2% Fed target unlike core CPI.
Finally, core PPI excluding trade services fell from 1.7% to 1.5%. Monthly trade services inflation was 0.8%. Headline monthly inflation was 0.4%, but without trade services, food, and energy, it was just 0.1%.

Consumer Confidence Crashes
Bloomberg consumer comfort survey isn’t followed as closely as the University of Michigan and Conference Board reports. But I still follow it. It’s real data from phone interviews. Comfort index showed much more optimism than the other 2 readings this summer.
Now, it looks much worse. In the past 3 weeks it fell the most since 2008. That doesn’t mean another 2008 like event is coming or even another recession is coming, but it is worrisome on a rate of change basis. Comfort index hit a 9 month low.
It dropped to 58 in the week of November 10th. There wasn’t a recession 9 months ago. The economy wasn’t tanking. On an absolute basis, this reading is fine, but it is worrisome because it implies worse results might be coming.
There was particular weakness for low income workers. That’s surprising because their wage growth has been the highest. They haven’t benefited much from the rise in stocks, but their employment rate is high and their real pay raises have been high. This concerns me as maybe there is weakness in the labor market not being picked up by other labor metrics.
Another possibility is it’s political. That would be a good thing because income growth matters more than politics. Each of the 3 categories in this report fell. The index measuring consumers’ opinion on the economy fell to the lowest since June of last year. Their assessment of their personal finances fell to the lowest since January and the buying climate was the weakest since this June.
Comfort for those making less than $50,000 per year fell for the 10th straight month. This is the longest negative streak since 2010. In this report, it stated that the poor started seeing weakness and that expanded into effecting the middle class as well. Categories with the lowest confidence in at least the past year were the following: men, people ages 18-34, those in the Midwest, black Americans, renters and people separated, widowed or divorced.
Retail Sales Growth Slows
Just like the Redbook some store sales reports suggested, the retail sales report showed weakening yearly growth. Yearly growth in motor vehicles and parts fell and yearly growth in non-store sales rose. Non-store sales growth rose from 13.93% to 14.25%. Keep in mind that this is the October report. Next 2 reports will be much more important as they include the holiday shopping season.
Specifically, headline monthly retail sales growth was 0.3% which rose from -0.3% and beat estimates for 0.2%. Retail sales growth excluding autos was 0.2% which missed estimates for 0.4% and rose from -0.1%. Even though yearly growth for motor vehicles and parts fell from 5.21% to 4.46%, monthly growth was a strong 0.53% because its comp was -0.77%.
Excluding autos and gas, monthly sales growth was 0.1% which missed estimates for 0.3% and the revised reading of -0.1% (from 0%). Monthly sales growth at gas stations was 1.1% even though yearly growth fell from -1.93% to -4.97%. Energy price comps will get easier in November which means yearly growth will improve.
Finally, control group sales growth rose from -0.1% (revised from 0%) to 0.3% which missed estimates for 0.4%. Yearly growth fell from 4.67% to 4.19%.

Yearly, advanced nominal retail sales growth excluding food services fell from 3.8% to 2.9%. Each category this paragraph fell for the 2nd straight time and had the weakest reading since May. Nominal yearly retail sales growth including food services fell from 4.1% to 3.1%.
Finally, real retail sales growth fell from 2.3% to 1.3%. This was a bad report as it mostly missed estimates and showed yearly growth declines. A key question is what this means for November growth which includes Black Friday (but not Cyber Monday).
If the Bloomberg consumer comfort index has any predictive value at all, this is only the beginning of the weakness that is to come. Personally, I’m still optimistic because consumers have a nice savings rate, don’t have a lot of debt, and the employment rate is high.
Recent Comments