S&P 500 Stocks - Keep Rallying
The stock market is extremely overbought in the short term. It’s so overbought that the 0.15% rally in the S&P 500 on Tuesday is impressive.
Nasdaq was up 0.19% and the Russell 2000 was up 0.33%. S&P 500 is up 10.89% for the year.
Even though we have 10 months left in the year, an entire year’s worth of gains have come. The CNN fear and greed index is at 68 which signals greed. That’s down 2 points from Friday even though stocks were up.
The best 2 sectors were materials and utilities. Utilities is the best performing sector in the past 12 months, principally because of the rocky Q4.
Consumer staples sector was helped by Wal-Mart as the sector increased 0.5%. The only 2 down sectors were healthcare and industrials which fell 0.25% and 0.07%.
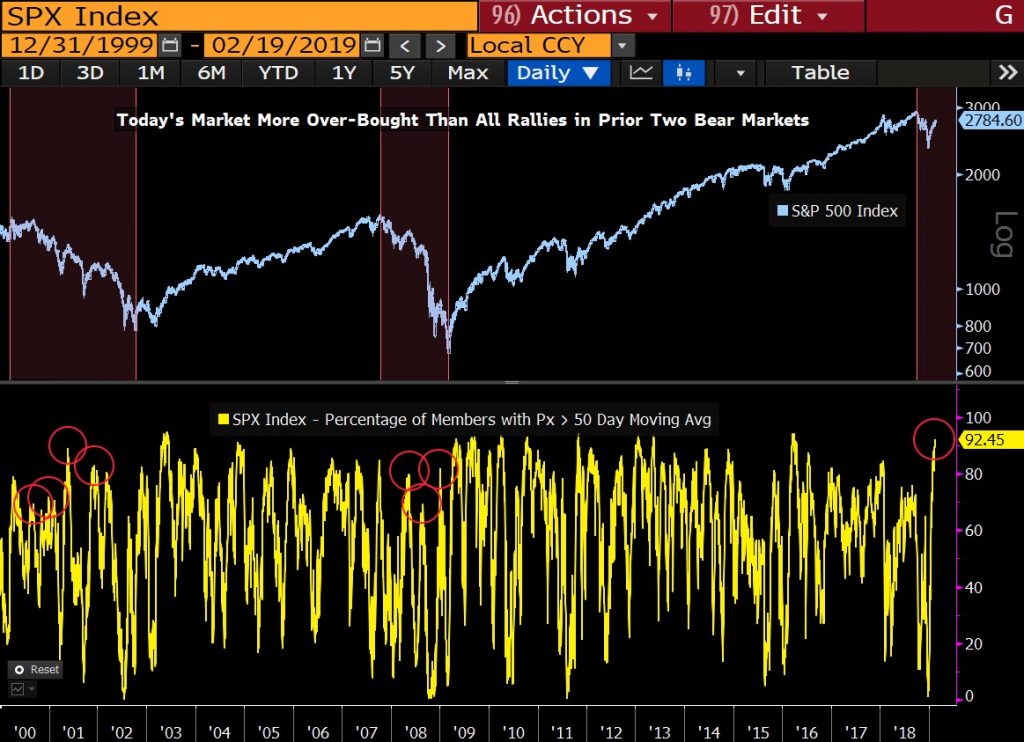
S&P 500 Stocks - 92% Above 50 Day Moving Average
As you can see from the chart below, 92.45% of stocks in the S&P 500 are above their 50 day moving average.
Since 1990, the median gains 3 months, 6 months, and 12 months forward are 5%, 9%, and 16%. The median drawdown after this signal was 1%.
This is unusually positive analysis which counters the bearish argument that this overbought market can’t maintain its momentum and hit new highs this year.
If you review each time 90% of stocks were above their 50 day moving average since 1968, stocks increased in the next 63 days 16 times and only fell 2 times.
That’s another positive spin on this extremely strong market breadth. The chart below shows a negative spin as it shows the market is more overbought than in the bear market rallies prior to the past 2 recessions.
Alternatively, that could mean this breadth implies a recession isn’t coming. If you do think a recession is coming, this is an amazing time to short stocks. I don’t see any indicators that support that hypothesis.
S&P 500 Stocks - 61% Above Their 200 Day Moving Average
Last week, some investors expressed concern that the S&P 500 was bumping up against its 200 day moving average. However, it has surpassed that easily.
In mid-October, early November, and late November, stocks peaked near the current level which is right above the 200 day moving average. If stocks were to fall from here, technicians would label that as major resistance.
As you can see from the chart below, just over 61% of S&P 500 firms are above their 200 day moving average. This is the highest percentage since September 10th. However, it’s still not at an extreme level because the market isn’t at its record high.

S&P 500 Stocks - Rally Almost Everyday
Bullish sentiment is so overheated that commercial hedgers were net long over $9 billion worth of Nasdaq index futures at the end of January. That’s the most since the financial crisis.
To be clear, since these are hedgers, they are usually short the Nasdaq. This long position probably increased since January because the Nasdaq is up since then.
Furthermore, the 14 day S&P 500 RSI is at 69.54 which is very close to giving an overbought signal. The 9 day RSI is at 75.73 which is an overbought signal.
As you can see from the chart below, the S&P 500 has been up almost 72% of the days in Q1. It is up 23 days this quarter. If the percentage holds, this will be the most positive quarter ever. The previous record was Q2 1955. Stocks have risen about half the time since 1928.

S&P 500 Stocks - Wal-Mart’s Greatest 4th Quarter In At Least 10 Years
The December retail sales report was a disaster, but Wal-Mart had a great quarter.
Most retailers had reported earnings by the time the December retail sales report came out, but Wal-Mart hadn’t until Tuesday morning.
The firm reported $1.41 in Q4 2019 EPS which beat estimates by 8 cents. It had $138.79 billion in revenues which beat estimates for $138.65 billion.
As you can see from the chart below, same store sales growth was 4.2% which beat estimates for 3.2%.
Because of the size of Wal-Mart and the number of analysts covering it, this is a monster beat. That stock gave up some of its early morning gains, but it still closed up 2.21% on Tuesday. The 18.7% decline in the stock from November 9th to December 24th was completely phony.
S&P 500 Stocks - Wal-Mart is now down just 3.18% from that peak which is the stock’s record high.

The CEO stated there was “a favorable economic environment” in which the firm took market share from rivals in food and toys.
Obviously, Toys R Us going bankrupt helped Wal-Mart’s toy division. The biggest retailer saying there was a favorable economic environment calls the terrible December retail sales report into question.
To be clear, the fact that Payless ShoeSource is closing 2,500 stores doesn’t mean the economic environment is terrible for retailers. There are always losers even in a strong economy. The winners are online.
The firm maintained its 2020 sales guidance and raised its dividend 2% to $2.12 per share. Same store sales guidance for fiscal year 2020 is for 2.5% to 3% growth.
Breaking down the 4.2% same store sales growth, 0.9% came from increased traffic and 3.3% came from higher average tickets. In Q4 2018, traffic was up 0.9% and tickets were up 1%. Online sales were up 43% in Q3 and Q4 2019. 2018 online sales growth was 40%. The firm’s goal is for 35% online sales growth in fiscal year 2020.
S&P 500 Stocks - Conclusion
This continues to be one of the strongest snapback rallies ever.
92.45% of S&P 500 stocks are above their 50 day moving average. Wal-Mart basically stated the December retail sales report was nonsense as it highlighted the positive economic environment. The firm had its fastest fourth quarter growth rate in 10 years.
It’s impossible for December to have been terribly weak for the company based on this growth. Redbook is also on Wal-Mart’s side, making the retail sales report even more suspect.
Recent Comments