Extreme Optimism Leads To A Small Decline In Stocks
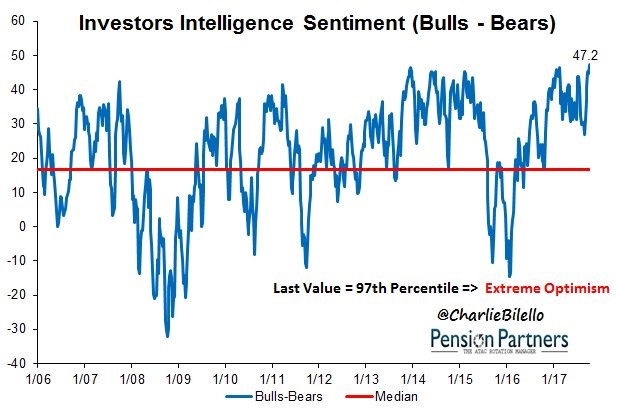
The market finally took a breather on Wednesday. It wasn’t a major selloff because dip buyers appeared mid-day. It was healthy to see because the run had gotten ridiculous. The S&P 500 fell 0.47%. It was driven lower by weak Chipotle earnings and poor AMD guidance. AMD stock fell 13.5% and Chipotle fell 14.6%. The chart below shows support for the argument that the market was overheated. As you can see, the investors intelligence sentiment survey showed the bulls outnumbered the bears by 47.2% which was the highest reading since 1987. It’s a great summary of the market for it to sell off less than 1% compared to the crash seen in October 1987. In this market a 2% selloff in a day is unheard of while the October 19th, 1987 crash had a 22% drop in the Dow. It’s a stark comparison between one of the most volatile periods in market history to one of the least volatile periods. I maintain my bullish leanings despite the high optimism because that can easily drop off with a few more days like today. The temporary drop in optimism at the end of the chart occurred without a 3% correction. That’s why I wouldn’t worry too much about the current complacency in the market.
I haven’t been focused on the near term trading action in the Shanghai composite as much as the American markets. The chart below shows China is also seeing volatility suppression in their markets in 2017. As you can see, the Shanghai composite has had less than 25 days with moves over 1%. Since 1993, there hadn’t been a year with less than 50 days of 1% moves. It appears 2016 was the year of negative rates and 2017 is the year volatility died in many global markets.

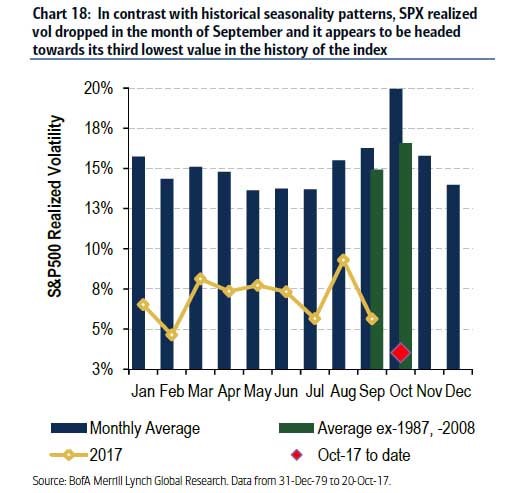
The chart below shows an updated realized volatility for the S&P 500 in October. Almost every month appears to have less volatility than the previous one. The yellow line shows that every month this year has had below the historical average realized volatility as the streak below 10% continues. The realized volatility of slightly above 3% in October will be the third lowest month in history. The selloff today might impact this slightly, but it was hardly a crash. We still have the Fed pick, QE, and earnings to get through by the end of the month which can spoil this placid market.
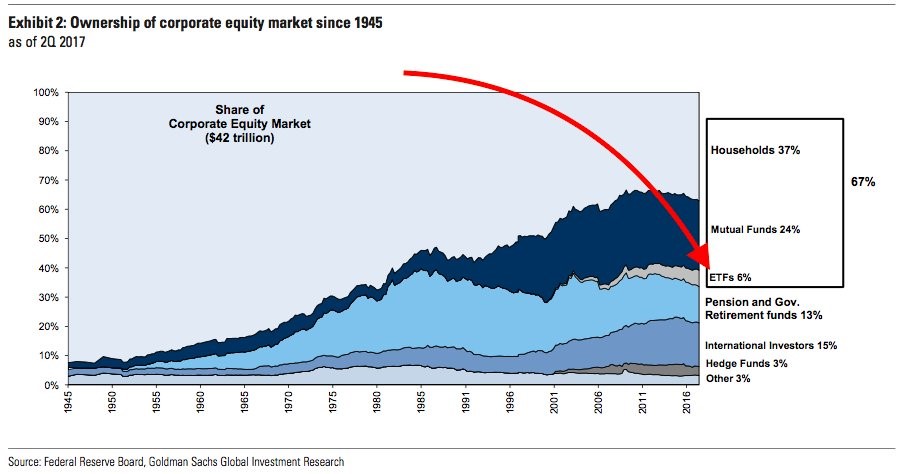
The most obvious response many give for the lower volatility is that ETFs are making individual trading less prevalent. While ETFs do affect the market, their effects tend to be over analyzed in proportion to their size. It sounds great to write articles about the death of the hedge fund industry, but the truth isn’t as bad as the headlines portray. The reality is hedge fund fees are dropping, but ETFs are still small. As you can see in the chart below, the ETFs are 3% of the market. That’s not enough to transform the way trading occurs. It’s possible, the advent of the internet makes us think more bad things are happening then actually are occurring. The 24 news cycle blows up microscopic issues into major problems. If that’s the case, the volatility suppression might be justified.
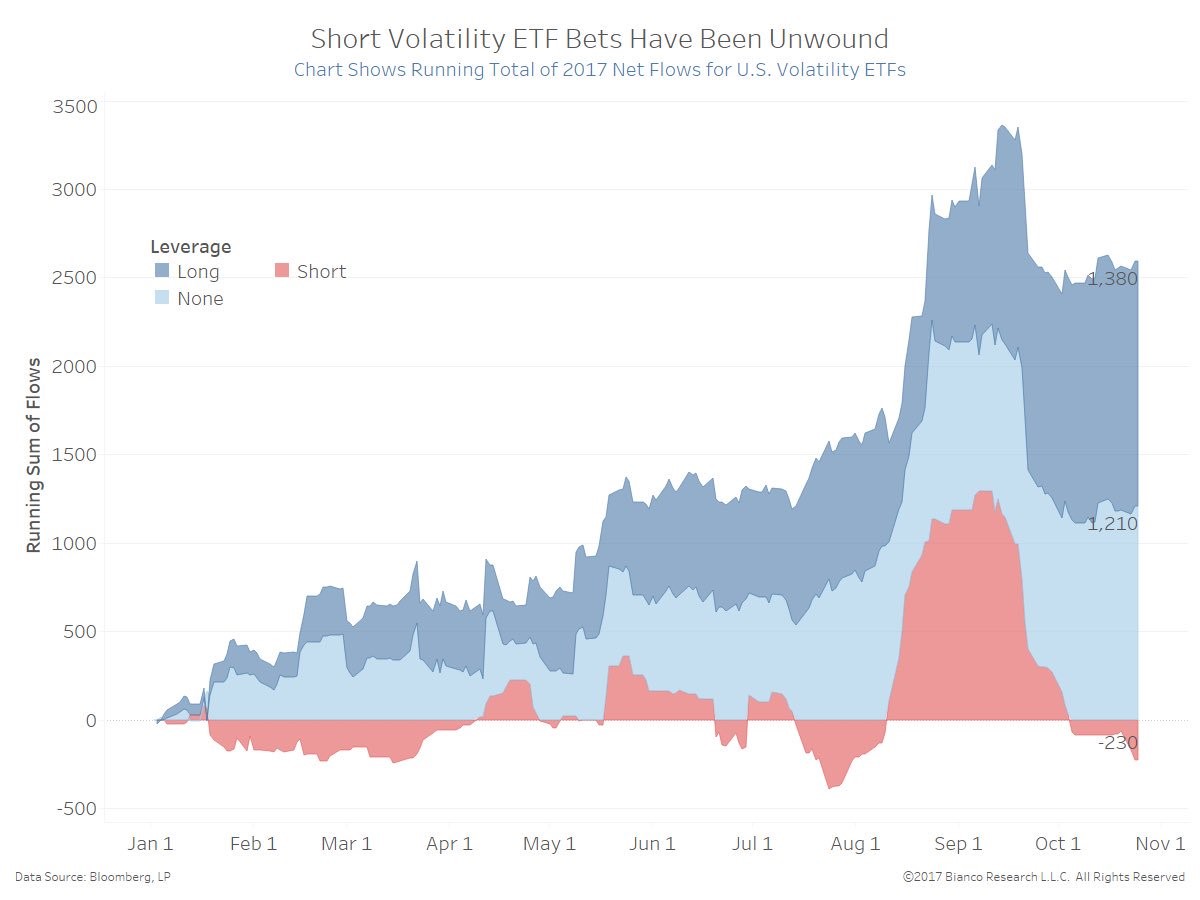
There are some bears who harp on how the short VIX trade will unwind when stocks fall, causing financial mayhem. I don’t think that’s the case. Anyone who is short the VIX will get hurt in a crash, but I don’t see the domino effect occurring. As you can see from the chart below, the leverage short the VIX has been unwinding in the past few weeks removing the systemic threat that some think this trade represents.
Will ECB Taper?
As we wait for the decision on the ECB’s tapering later this week, Bloomberg came up with a comparison between the Fed’s taper and the ECB’s taper. As you can see, the Fed was much closer to achieving its 2% inflation target than the ECB currently is at. However, I’d also point out that the ECB has already started its tapering this year by cutting the bond purchases by 20 billion euros per month in April. This shows that the ECB is well on its way to ending the bond purchases even if inflation doesn’t reach the 2% goal. Don’t take this chart to mean the ECB won’t taper. Another tidbit is that the Fed had a zero Fed funds rate in 2013. Technically it was 0.00% to 0.25%. The ECB has a lower rate at -0.40%. That means the ECB has more wiggle room with tapering.
The ECB expects to raise rates a year after QE ends. That could mean the rate will be raised in early 2020. The Fed started raising rates 2 years after it started tapering, so the ECB is one year delayed on that front. Although the global economy looks great, I have a hard time thinking this elongated process will go off without a hitch, given the demographic, debt, political, and regulatory issues in Europe which seem to have been pulling it down since 2008.

Apple - AAPL Is Important To Malls
As we await the release of the iPhone X, let’s keep in mind that not only is the iPhone critical to S&P 500 earnings, but AAPL sales are also critical to malls. Malls are already in a tough state as shopping shifts to online. Any weakness from Apple this holiday season would be devastating for some malls already on the brink of closing down. The table below shows the average Apple store has $8,000 in sales per square foot. This boosts the average sales per square foot from $450 to $601. Apple is the most successful retailer in the world. Obviously, if the iPhone X is a dud, these numbers will decline. Because the iPhone X was delayed, we can see the large number of customers avoiding the iPhone 8. The question is if they will upgrade. AAPL is only 4.66% off its all time high showing how optimistic investors are that this product will be a slam dunk.

Recent Comments