
This Cycle Has Been Speedy
This cycle was put on hyper-speed. We had a bear market in a few weeks and a rally big enough to be considered a bull market in a week. Personally, I think the correct way to measure bull markets is for them to start after the previous peak is surpassed. Everything is moving very quickly. That counters the timeline comparisons to other bear markets and recessions.
Sometimes you hear investors claim this is just the beginning because the market topped in February. However, this isn’t like a normal recession. Whenever the number of new COVID-19 cases stops increasing we will be a few weeks away from the economy reopening which, in turn, is a few weeks away from the economic data improving.
During the Chinese pandemic, recession, and subsequent recovery, many thought to buy stocks when the bad data started coming out. Normally, you wouldn’t buy so soon in the cycle, but this has the potential to be a quick cycle if COVID-19 gets under control soon. The quicker it’s under control, the quicker the recovery will be.
Longer the shutdowns lasts, the greater the likelihood of a longer lasting recession where the economy doesn’t come back immediately. America is on a similar time scale even if the Chinese data may have been incorrect.
It’s possible or even likely there were more cases than China let on, but the country can’t lie about reopening. We are seeing clear evidence of the economy starting to recover. According to satellite imagery, the nitrogen dioxide concentration in China has increased sharply in March from February. That implies an increase in industrial and transport activity. Therefore, the recommendation to buy stocks when the poor America data comes out holds.
Too Much Negativity
Many become even more bullish when the economic projections overshoot to the downside. The information below is a quintessential example of a prediction overshooting to the downside. It seems like ISI is trying to make the most outlandish prediction possible. As you can see, the firm called for -50% Q2 GDP growth and only 5% growth in Q4. Normally, 5% growth is very strong, but it’s not when the comp is this easy. The firm is predicting an L shaped recovery.
It’s obviously possible that this prediction is correct if the shutdown lasts another 3 months. However, the point isn’t whether it is correct or incorrect. The point is the most negative possible scenarios are becoming the base case projection. That’s a buy signal for investors.

Projections have continued to race to the bottom. If you have a race to see who can come up with the worst prediction, you will quickly have estimates that can easily be beaten. ISI sees -16% GDP growth in 2020 and only 5% growth in 2021. The chart below shows global GDP growth along with JP Morgan’s projection. JP Morgan is bearish in its own right by calling for a recession worse than the 2008 financial crisis.
As you can see, the firm called for about a 4% downtick in GDP. ISI’s call for a 16% decline in GDP in 2020 would be worse than the Great Depression and worse than the post WWII decline in GDP. The worst is priced in, if we are seeing such estimates.
Obviously, this isn’t the consensus, but it would only become the consensus if we had further evidence that the shutdowns will be elongated. The fact that a serious firm is making this forecast is reason enough for me to view this as a bullish signal.

U Or L Shaped Recovery?
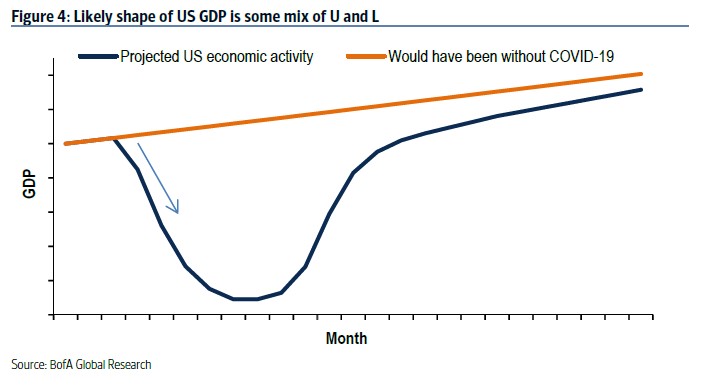
Investors are much more confident than economists. Only 1/3rd of economists see a V-shaped recovery. Others see a U or L shaped recovery. Personally, I only see a L shaped recovery if the shutdown lasts 6 months or more. The economy will get back on track within a few quarters if the shutdown starts to be lifted in May or June.
It’s difficult to know when the shutdown will end. Models are shifting towards expecting fewer deaths. It’s possible the economy restarts with limits on public gatherings until a vaccine is discovered. That could take 11-17 months.
As you can see from the chart below, some economic activity might not be recovered once this recession ends. According to Bank of America, by Q4 2021 European GDP growth will be 2% lower than it would have been without COVID-19. There will be a 6% cumulative GDP growth loss in the recession. Once again, I think it’s bullish for the base case to be either a U or L shaped recovery because it means there’s plenty of room for the data to surprise to the upside.
Stocks Like To Get Ahead Of The Data
Stocks usually are ahead of the game, but this time they will be even further ahead of the economy because it’s clear there will be a recovery once the shutdowns end. As you can see from the charts below, in the last 2 cycles the unemployment claims peaked a few weeks after the stock market troughed. Distance between the trough in the stock market and the peak in unemployment claims could be larger in this cycle.
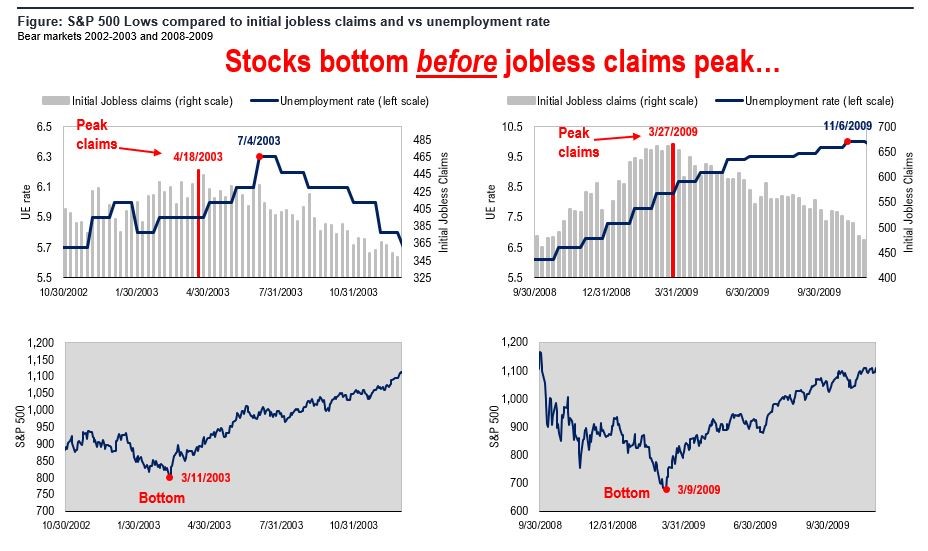
On the other hand, it could be right on schedule because claims can’t sustain the high the level they are at for much longer or everyone will be out of work shortly. It’s possible this coming week’s report is the peak. That partially depends on when the shutdowns start ending. The shutdown in NYC might not end until the end of April.
Obviously, we should be open to the possibility that the recent stock market low wasn’t the bottom of this bear market. Personally, I think it was the bottom. But if policymakers decide the economy will be shutdown for a few months after the number of new cases starts to fall, then stocks might fall.
We can gauge the timing of the reopen based on when Italy reopens. We can expect Italy to reopen in May. Many expect America to reopen in phases over the next few weeks. Some states with low populations never closed.
Recent Comments