Apple - AAPL Reaches A $900 Billion Market Cap
Arguably the most important company in the stock market, AAPL, reported earnings a day before the iPhone X goes on sale. The company beat estimates for $1.87 per share by reporting $2.07 in EPS. Revenues of $52.6 billion beat estimates for $50.7 billion. Q4 iPhone sales were 46.7 million which beat estimates for 46 million. Gross margins were 37.9% which missed estimates for 38.0%. With the sales of the iPhone X, the gross margins will improve in Q1. Services were $8.5 billion as the iPhone has become the hub where many purchases are made. While many criticize Tim Cook for not innovating like Steve Jobs, the company has done a great job of squeezing more profits out of sales by increasing the average selling price and selling more services. The stock doesn’t care about the abstract term ‘innovation’; it only cares about current and future profits.
The China division had sales of $9.8 billion which was a 12% increase. This is another company showing positive results from the country proving China’s economy is headed in the right direction. The worry is about how the Chinese consumer will react to the high price tag of the iPhone X. Mac revenues were $7.17 billion which was a 25% increase. It continues to grow faster than the PC industry. Finally, the Other Products division had $3.23 billion in revenues which was up 36% from last year. The Apple Watch is a big component of this business. Sales were up 50% for the third straight quarter. The ability of the Apple Watch to work independently of a smartphone allows Android users to buy it as well. This boosts the addressable market and makes the device have more usability. Runners may want to take their watch on a run, but may not want to carry their heavy phone.
Volatility Gone
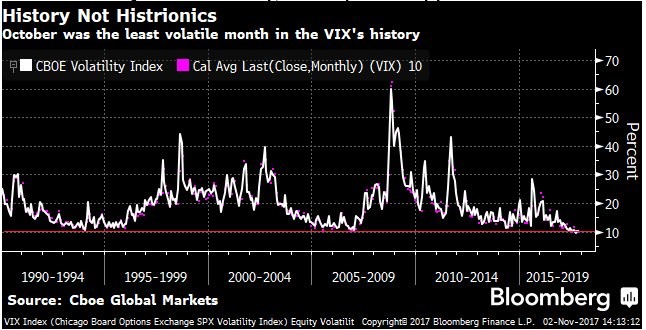
As you can see from the chart below, the VIX had its lowest month ever in October as we close out one of the least volatile years ever. The October VIX average was 10.12 which beat the July 2017 average of 10.26. The top 4 lowest months are all from this year. With earnings season mostly over and Trump’s pick as Fed chair done, there’s nothing that stands in the way of the stock market in the next 2 months. The Fed’s rate hike is already priced in. Prior to October 23rd, the VIX had closed below 11 for 30 straight days which was the longest streak by far. The longest streak in the prior bull market was 10 and the longest streak in the 1990s bull market was 8. I wish we had data on the VIX from the 1920s because that would be the only period which might rival this current action. Considering the fact that the rolling 12 month volatility in the S&P 500 is the lowest since at least 1928, we might be in the quietest period ever. On Thursday, the VIX fell 2.65% to 9.93 as November tries to take out the October low. The Dow hasn’t had a 1% move in 52 trading days which is the longest streak since at least 1930.
Labor market
The hurricanes had a big effect on the labor market in September as the ADP report only showed 135,000 jobs created and the non-farm payrolls report showed 33,000 jobs lost. That BEA report will likely be revised in Friday’s report as it tries to figure out the effects of the hurricanes. The ADP report showed a big increase from last month, coming in at 235,000 jobs created. This is partially responsible for the economists predicting a massive 310,000 jobs created in October. That would be a very rare feat. I doubt the stock market would care much about the headline because everyone knows it is augmented because of the weather. The details of the report, which I focus on so much, will also be sullied by the weather effects.
Looking at the details of the ADP report, there was strength across the board in terms of sizes of businesses. Small businesses added 79,000 jobs, midsized businesses added 66,000 jobs, and large businesses added 90,000 jobs. Even though the services businesses added 150,000 jobs and the goods producing segment added 85,000 jobs, the biggest weakness came from within the services sector. Trade, transportation, and utilities lost 50,000 jobs. That could be related to the supply chain problems caused by the hurricanes. Otherwise, it’s surprising to see because the Cass Freight index is doing very good. The information tech sector lost 27,000 jobs which is remarkable given the strength in the tech sector.
Based on this report, it’s fair to say the BEA report will show over 250,000 jobs created on Friday. The other aspect I look at to forecast the BEA report is the jobless claims which had another great report on Thursday. The unemployment claims fell 5,000 to 229,000. This is near the 44.5 year low of 223,000 reached a couple weeks ago. I am interested to see what the unemployment rate is in the Friday jobs report because it fell to a 16.5 year low of 4.2% despite the decline of 33,000 jobs. In theory, it could fall to a 3 handle which would be remarkable. It would match the incredibly low jobless claims we are seeing.
Obviously, the low jobless claims and unemployment rate beg the question of when inflation will start to pick up. The chart below shows the NY Fed’s new inflation reading has inflation at the highest growth rate since the expansion started. While in a bind, the Fed appears to have created a new gauge that says what it wants. Every inflation point above 3% causes PE multiples to fall 2.69 points. While this inflation measure showing it to be 2.8% is at an 11 year high, I wouldn’t expect multiples to fall until the PCE or the CPI inflation measurements start to increase. I think the biggest risk to stocks in 2018 is heightened inflation. We’re still in the mode where inflation is so low, an increase is a good thing. I expect that to change next year.

Recent Comments