
You know how the story goes. Goldilocks wanders into the home of the three bears and tries to find which bed, etc. is "just right". Trading can be the same way. You think you see something in a chart, data, news, etc. and wonder if what you're seeing is "just right". On the heels of Housing Start and Building Permit data, a large, bearish rolling trade was made today. This trade helps reaffirm the bearish outlook for the iShares US Home Construction ETF (BATS: ITB).
Let's take a closer look at the economic data, option activity, and then look at it's holdings to find something "just right" using the Magnifi platform.
Housing Data
This week has been a big one for housing data and today was no exception. These mile markers are significant for housing stocks and thus ITB. Today's data included both Housing Starts and Building Permits.

As you can see in the image above, permits had a positive surprise and starts had a negative surprise compared to analyst estimates. The fact permits beat estimates is good for homebuilders in that they are establishing a pipeline of future home production. However, starts is where the proverbial rubber hits the road. While the starts number missed estimates, it's still in nosebleed territory and makes you wonder if we're peaking just ahead of the Federal Reserve raising rates.
ITB Option Activity
Looking to the options market can be helpful. Identifying large block trades is an indication of institutional interest and can reflect expectations. Today's trade in ITB was a rolling trade from the 18 FEB 22 expiration to the 25 FEB 22 expiration. Let's take a closer look a the opening trade for 25 FEB 22:
- 11,400 25 FEB 22 $67 puts BOT in 1 print @ $1.20
- 11,400 25 FEB 22 $64 puts sold in 1 print @ $0.45
The opening trade above was rolled out a week and down a strike from the 18 FEB 22 68/65 long put vertical for a net credit of $0.02. The roll closed the 18 FEB 22 expiration and opened the 25 FEB 22. While the rolling order was done for a small credit, it does reinforce the bearish near-term outlook and maximizes it's profit if the price is below $64 by next week's expiration.
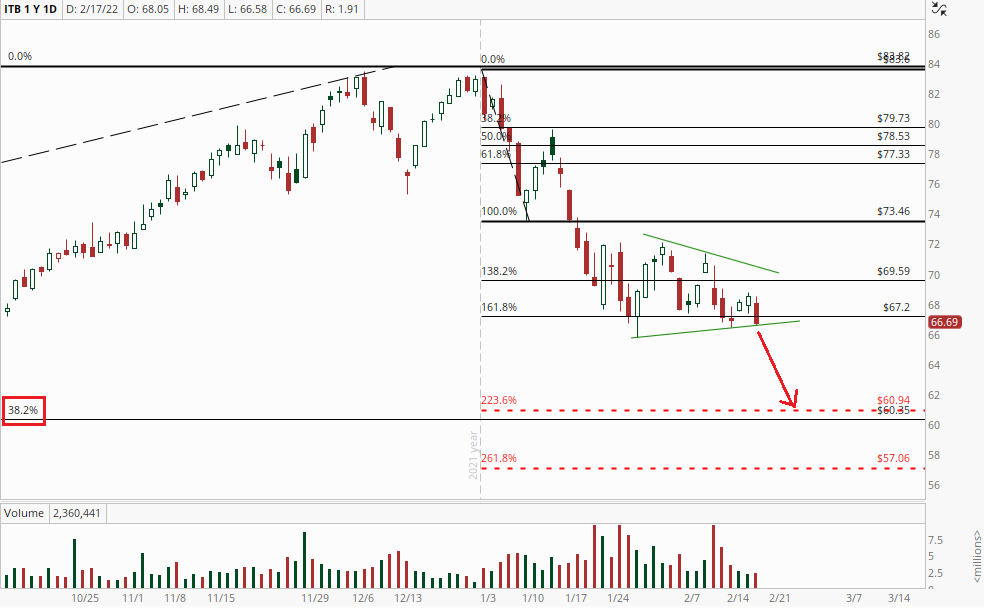
ITB Technicals
ITB is currently forming a symmetrical triangle following a decline in mid-January. A close below today's low would confirm the breakout and would provide a target between $61 and $57. Those levels are represented by the 223.6% and 261.8% Fibonacci projection levels. The $61 price level is also close to the 38.2% retracement level from the prior longer-term up trend.
ITB Magnifi'd
The above trade is an indication of the expected direction and magnitude of the price. However, as an ETF there are holdings within the fund that can be highly influential and may provide another opportunity. The video below will take a closer look at ITB, it's components and risk/reward using the Magnifi platform.
Conclusion
While not every trade is a "Goldilocks" trade from the outset, the idea is to find something that meets your trading criteria. However, as you can see, sometimes taking a little extra time may allow you to find something just a little better or "just right". In the case of the option activity on ITB, a potential bearish trade outlined in the video on Lennar Corp (NYSE: LEN) could fit that analogy, well, just right.
You can open a free Magnifi account here and get free access to TheoINVEST!
See how unlocking the Vomma Zone can help you better understand when volatility is about to rise.
Not a subscriber? Become a TheoTrade member
Recent Comments